Also – a big thanks to the Big Picture economic blog for highlighting this report.
Despite the fact that household mortgage borrowing has slowed in recent quarters, the leverage in owner-occupied real estate reached a record high 46.4% in the third quarter of 2006, as shown in chart 8. If mortgage borrowing slowed, why the increase in leverage? Because, as shown in chart 9, there has been a sharp slowdown in the growth of the total market value of residential read estate. With a still sizeable excess inventory of homes for sale, continued weak growth, perhaps even a contraction, in the market value of residential real estate could reasonably be expected in 2007.
While all of this may sound a bit complicated, it’s really simple when you rephrase the eco-geek language with everyday English. All Mr. Kasriel is doing is to compare the total outstanding household mortgage debt with total household real estate holdings. This is the leverage ratio, and economists or financial people use this ratio to determine if a household has enough assets to cover all its liabilities. For comparison purposes, let’s use the first three quarters of 2005 from the Fed’s Flow of Funds report. Total household residential real estate holdings increased from $17.6 trillion in the first quarter of 2005 to $18.9 trillion in the third quarter of 2005 – or an increase of 7.38%. For the same quarters in 2006, residential real estate increased from 19.9 trillion to 20.5 trillion or an increase of 3%. In other words, residential real estates’ upward appreciation for the first three quarters of 2006 was half the rate as the first three quarters of 2005. Because real estate is slowing in appreciation, the incredibly high amount of outstanding mortgage debt at the national level – 9.5 trillion in the third quarter of 2006 – takes a larger percentage of the value of real estate. Just as importantly, residential real estate now comprises the largest percentage of household assets since 1955.
Conversely, homeowner’s equity – which represents the amount a person actually owns in real estate –- is at a post WWII record low.
Household liquidity fell to a post-WWII low in the third quarter of 2006. I am using as a measure of liquidity household deposits and money market mutual funds as a percent of total household liabilities. Some might respond that with all the different sources of credit available to households today, they do not need to hold as large a ratio of liquid assets as in the past. To this I would respond with three counter-arguments. Firstly, households already have borrowed so much that their level is at a post-WWII high (see chart 13). Secondly, households have already borrowed so much that their debt service burden is at a 25-year high (see chart 14). And thirdly, residential real estate which accounts for 30.5% of the total market value of households assets (see chart 15), is the single largest asset in households portfolios compared with deposits, credit market instruments, corporate equities and other tangible assets. Of these other asset categories,, residential real estate probably is the least liquid. In sum, household have never been as highly leveraged as they are now or as illiquid as they are now, and their single largest asset is in danger of actually falling in value.
What we are looking at above is how much cash on hand do households have to pay off their debts. And the answer is – a record low amount. As Kasriel points out, alternative means of financing -- home equity loans for example -- would require additional debt which is already at historically high levels. This is where the US savings situation – which is essentially a savings crisis – really comes into play. Just for the sake of argument, suppose a homeowner has an adjustable rate mortgage (not they anyone would ever consider that option). Now suppose the payments on that ARM increase at a high rate. Does the homeowner have the necessary savings to make the payment? The answer is maybe not. And that’s a huge problem. It implies that if there is a sudden shock to the US economy that causes a drastic slowdown (like a lot of central banks dumping dollars because of a record trade deficit), homeowners will be scrambling to make their payments.
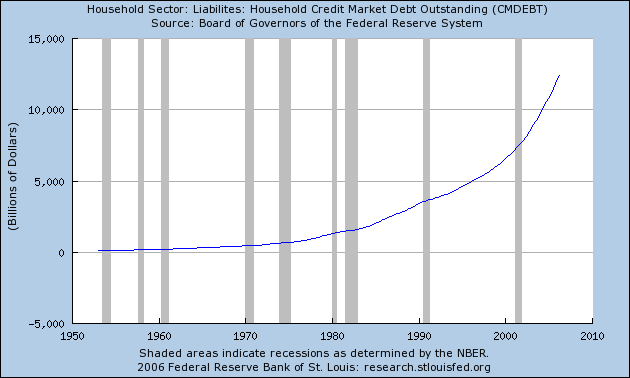
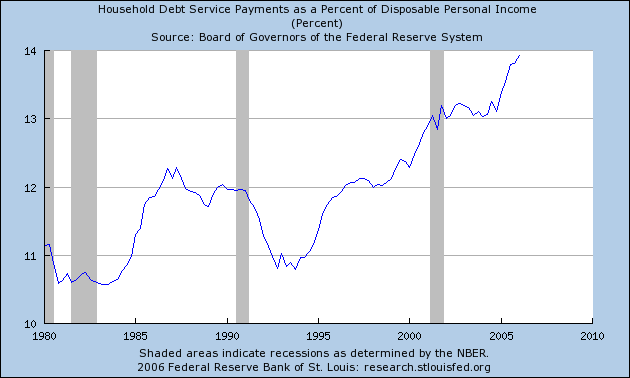
Just as important note the absolute household debt level and debt payment levels are now at record highs -- as in highs not seen for 25 or more years.
Remember these graphs, because you've seen them before and you'll see them again:
Total household debt outstanding:
Household's debt service ratio as a percentage of disposable income:
An excerpt from the above paragraph sums up the problem:
In sum, households have never been as highly levered as they are now or as illiquid as they are now, and their single largest asset is in danger of actually falling in value.

No comments:
Post a Comment