Showing posts with label Bonddad. Show all posts

Monday, April 30, 2007

Why Housing Is So Important To the US Economy

April 30, 2007

By Bonddad

One of the main reasons I have focused a great deal of attention on housing is its primary role in the current US expansion. From jobs to consumer spending money, housing have been the driver. Below I will explain how this works.

These paragraphs are from an interview in Barron's with Bennett Goodspeed of Inferential Focus (subscription required):

We've been talking about housing for 2½ years. The anomaly of the 2001-2002 recession following the dot-com blowup was that consumer spending never slowed down and personal debt never slowed down. At the same time, real incomes were not increasing. It was the first time in decades where there were five years straight in which real incomes did not increase. Cash-out refinancing and home equity loans filled the gap. This is the first time in the postwar period that the housing market has fueled the economy. It has regularly gone through the cycles with the economy, but it hasn't ever fueled the economy and supported consumer spending. A lot can ripple out from the housing market. We're seeing the first wave. We are suggesting to clients that corporate reactions to protecting earnings might be a hidden factor that could lead to other shock waves involving housing.

Corporate managements have been so well-trained to cut back on expenses to protect earnings that it might be the catalyst that trips the next wave. There's been a huge increase in housing supply on the market, turnover is way down, but prices have plateaued after going down a slight amount. That's because we haven't had any forced sales. If there are corporate layoffs, there will be forced sales. There has been a lot of leverage created in the housing market and it could lead to a significant decline. About 40% of the new jobs in the last four years are housing-related. Housing is 23% of the overall economy. While there are offsets -- commercial real estate is doing well and the government is hiring -- this has the potential to tip the scales. It could lead to the Fed lowering rates, and if we've got to lower interest rates to stimulate the economy, it takes the incentive out of owning dollars. That becomes tricky when you consider it's important for the Chinese to help support our economy by continuing to buy dollars.

In the first paragraph Goodspeed is talking about the relation between incomes, consumer spending and household debt. What he's basically saying is incomes didn't increase for a few years but consumer spending continued to increase. That means the money for consumer spending had to come from somewhere, and housing provided the funds in the form of home equity withdrawal (HEW).

Let's coordinate several pieces of data to see what Goodspeed in talking about. (This information is from the Bureau of Labor Statistics). In November 2001, the average hourly earnings of production workers was $14.74. This number was $17.22 in March 2006 for an increase of 16.82%. Over the same time, the inflation gauge increased from 177.4 to 205.352 for an increase of 15.756%. That means for the duration of this expansion, wages have increased 1.06%.

At the same same time consumer spending has continued unabated. Personal consumption expenditures were $7.188 trillion in the fourth quarter of 2001 and $9.589 trillion in the first quarter of 2007 for an increase of 33.4%. Using the inflation number from above (15.75%) we get an increase of 17.65% in consumer spending. Yet, wages only increased 1.06%. Where did the extra money come from?

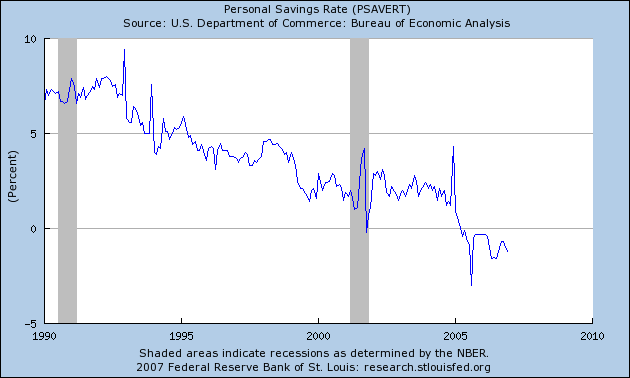
It wasn't from savings. The US savings rate was about 2% of disposable income in November 2001 and has been negative for the last 8 quarters. That means consumers have been dipping into savings to pay for their expenditures. However, the decrease in savings isn't enough to make-up for the increase in consumer spending. Here's a chart.
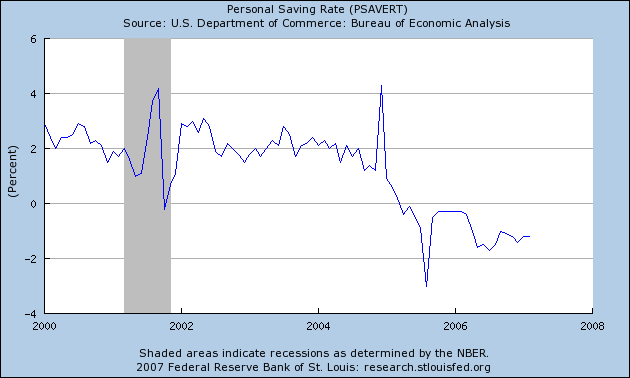
Photo Sharing and Video Hosting at Photobucket

So let's review. Wages haven't increased much beyond inflation for the duration of this expansion. Yet consumer spending has increased. But consumers aren't dipping into their savings. Where is this extra-money for consumption coming from?

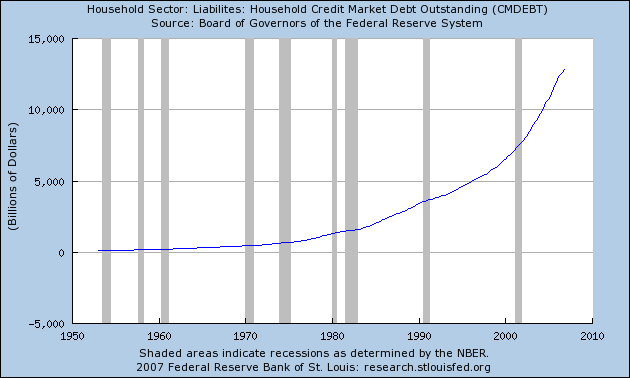
Debt. According to the Federal Reserve's Flow of Funds Report household debt (mortgage + credit card debt) has increased in a big way during this expansion. In 2000, household debt was 97% of disposable income; at the end of 2006 it was over 130%. over the same period, household debt increased from 74% of GDP to over 90% of GDP.

Let's look at jobs.

According to the Bureau of Labor Statistics, there total private employment was 130,883,000 in November 2001 and 137,622,000 in the latest survey. That's a total gain of 6,739,000. over the same period, construction employment was increased from 6,784,000 to 7,713,000 for a gain of 929,000. The BLS classifies real estate jobs under financial services, which increased from 7,845,000 to 8,451,000 over the same period. About 20% of these jobs are real estate related, or 121,000. In addition, over the same period professional services increased from 16,094,000 to 17,829,000 or a gain of 1,735,000. Let's assume that 20% of these are in some way related to real estate (appraisers, architects, lawyers etc..), which is 279,400 jobs. Adding these rough estimates, we get 1,329,000 jobs, or about 20% of the total jobs created. It's important to remember that Goodspeed has a group of talented number-crunchers on his staff who have access to far more detailed information. In other words, comparing his methods to my rough guestimates, I'd be inclined to take his analysis over mine. However, regardless of who's right, even 20% of total jobs is a ton of jobs created by a single industry. The point of all of this is simple: housing has created a ton of jobs in this economy.

SO, as a source of funds to fuel spending and as a driver of employment gains, housing is very important. So far we've seen the housing slowdown hit GDP for 4 quarters in a row. There hasn't been a big hit to employment yet. But with the slowdown in home construction, I wouldn't count on that lasting.

For economic commentary and analysis, go to the Bonddad Blog

Monday, April 2, 2007

The Debt Explosion, Income Inequality and Economic Fairness

Apr 2, 2007

By Bonddad
bonddad@prodigy.net

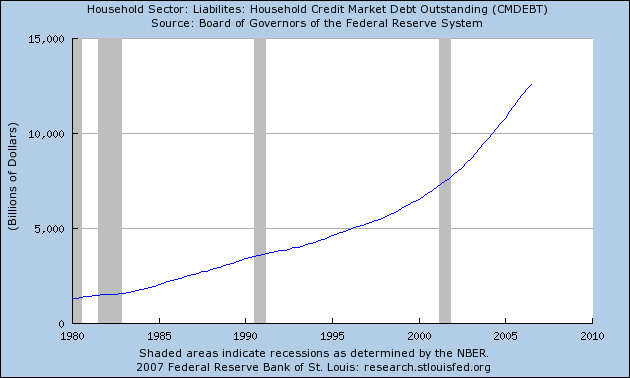
By now I think everyone who reads anything I have written over the last few years is familiar with this graph which shows the rise of household debt over the last 40+ years:

Photo Sharing and Video Hosting at Photobucket

Let's look at how this is playing out.

From the WSJ:

"Having a credit card is kind of like being a millionaire," says Scott Davis, a 37-year-old facility maintenance worker who lives in Arlington, Texas. He says he and his wife, whose household income is $38,000 a year, had "seven or eight" credit cards they used to buy sporting goods, go on vacations and remodel their home.

Mr. Davis isn't unusual. According to Fed data, outstanding debt, including mortgages, for families in the bottom 50% of earners -- those with household income below $43,000 -- almost doubled to an average $40,676 in 2004 from an inflation-adjusted $20,733 in 1992. Debt outstanding in the top 50% of households rose 83.5% to $150,821 in 2004 from $82,214 in 1992.

Ray Hooper, education and housing director at Consumer Credit Counseling Service in Dallas, says with credit conditions so easy, lower-income consumers have been able to "get what they want, even though they can't afford it." And the easy credit isn't just related to subprime lending. "It's not just the house," adds Mr. Hooper. "It's the furniture, the appliances, the lawn mower."

Let's go back through this paragraph to see what's going on.

1.) The couple had an annual income of $38,000.

2.) They had "7 or 8 credit cards."

Let's go through it one more time ....

$38,000 in income and 7 or 8 credit cards.

That is insane. There is no other way to describe it.

At this point we get into a discussion about the lines between corporate responsibility and personal responsibility. Or better yet, this is really a discussion about the difference between corporate and personal irresponsibility.

Yes I know this couple probably received about 10 mail offers/week for a credit card. And in doing so soliciting companies were pretty irresponsible.

At the same time, when 1 credit card is maxed out it's a really stupid idea to get another card instead of paying the old one off.

But I digress from the point I want to make.

Are we really a rich country, or are we a country living on borrowed growth -- debt-financed growth we haven't paid for yet? The answer is the latter - we're living off growth we haven't paid for yet. Think about the following statement from Barron's (subscription required):

So far this decade, nominal gross domestic product has risen at a 5.1% pace, while outstanding credit-market debt is increasing at 8.4%, notes Punk Ziegel analyst Richard Bove. "If the long-term rates were to rise further or incomes grow at slower rates, then it seems highly likely that there would be a rash of defaults throughout the economy," he says.

Debt is growing faster than GDP. That means -- as the above analyst points out -- if the economy slows we may have a bigger problem as debt defaults move through the system.

This is where another really important issue comes into play -- income inequality which grew in 2005.

Income inequality grew significantly in 2005, with the top 1 percent of Americans — those with incomes that year of more than $348,000 — receiving their largest share of national income since 1928, analysis of newly released tax data shows.

The top 10 percent, roughly those earning more than $100,000, also reached a level of income share not seen since before the Depression.

While total reported income in the United States increased almost 9 percent in 2005, the most recent year for which such data is available, average incomes for those in the bottom 90 percent dipped slightly compared with the year before, dropping $172, or 0.6 percent.

The gains went largely to the top 1 percent, whose incomes rose to an average of more than $1.1 million each, an increase of more than $139,000, or about 14 percent.

The new data also shows that the top 300,000 Americans collectively enjoyed almost as much income as the bottom 150 million Americans. Per person, the top group received 440 times as much as the average person in the bottom half earned, nearly doubling the gap from 1980.

People who aren't benefiting from economic growth -- and there are a ton of those people in the current environment -- want a piece of the pie. That's a natural human emotion. But the problem is to benefit, most people have to go into debt which only increases their inability to move up the socio-economic ladder.

Let me be clear: I'm a capitalist. I like money. I'm not run by this desire, but I certainly wouldn't turn down a million dollars in the name of political thought purity.

At the same time, we have to think about how the benefits of the largest and most productive economy in the world are distributed to everybody -- not just those who can afford to buy the latest political party du jour.

Update [2007-4-2 9:31:11 by bonddad]:: Since 1975, total household debt outstanding has increased as a percentage of GDP.

The Fed's Flow of Funds statement goes back to 1975.

GDP is from the Bureau of Economic Analysis (see link on my blogroll).

Total Household debt outstanding/GDP = total household debt outstanding as a percentage of GDP

75. 734/1638 = 44%

80. 1396/2789 = 50%

85. 2270/4220 = 51%

90. 3589/5803 = 61%

95. 4855/7397 = 65%

00. 6999/9817 = 71%

05. 11803/12455= 94%

06. 12815/13246 = 96%

For economic commentary and analysis, go to the Bonddad Blog

Sunday, April 1, 2007

The Economy Isn't Looking That Good Right Now

Apr 1, 2007

By Bonddad
bonddad@prodigy.net

The first quarter of this year has not been good for the economy. I have written extensively about the housing market (simply do a search on my name and you'll see a plethora of articles). However, other numbers have come out that show activity is weakening on a variety of fronts. While we're not in a recession, we may be approaching one. And worst of all, inflationary pressures may prevent the Federal Reserve from lowering interest rates.

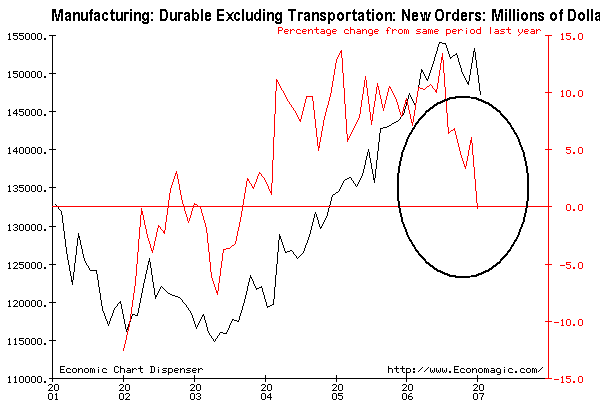
Durable Goods Orders Down 4 of the last 5 months

Durable goods are goods that last longer than 3-5 years. These goods are more expensive. Therefore, an increase in purchases is considered bullish and a decrease is considered bearish. These orders have decreased 4 of the last 5 months.

Photo Sharing and Video Hosting at Photobucket

Here's a chart of the year-over-year change in durable goods orders. It does not include the latest number, which would send the red line into negative territory.

Photo Sharing and Video Hosting at Photobucket

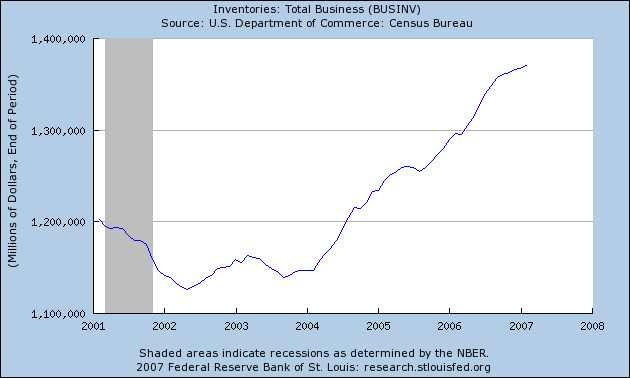
Increasing Inventories

Inventories are a tricky economic number to interpret. Because of improvements in supply-chain management, I would argue inventories are less important than in previous expansions. However, businesses have increased the amount of "stuff" they have on hand. This means a few things. First, a decrease in orders because businesses already have enough stuff to sell and use. In addition, it may also mean slower sales or an overestimation of sales increases. Either way, an inventory increase is a sign that future activity may decreaese.

Photo Sharing and Video Hosting at Photobucket

Oil Prices and Supplies

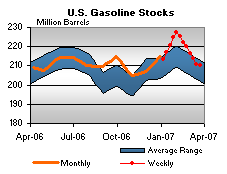
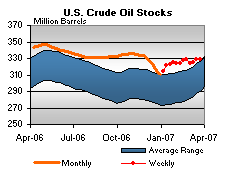
Gas inventories have dropped sharply for the last few weeks and oil inventories are lower now than at the same time last year.

Photo Sharing and Video Hosting at Photobucket

Photo Sharing and Video Hosting at Photobucket

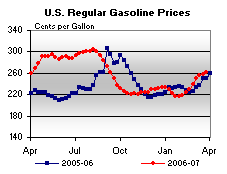
Gas prices are higher than this time last year.

For the eighth consecutive week, gasoline prices increased, rising 3.3 cents to 261.0 cents per gallon for the week of March 26, 2007. Prices are now 11.2 cents per gallon higher than at this time last year

Here's a chart:

Photo Sharing and Video Hosting at Photobucket

What's particularly important about gas prices is their decrease at the end of last year helped to lower inflation. Now with prices increasing they will probably add upward pressure to CPI (see inflation below).

The GDP revision

4th quarter GDP was revised up, from 2.2% to 2.5% growth. But that's not exactly good news.

The increase in real GDP in the fourth quarter primarily reflected positive contributions from personal consumption expenditures (PCE), exports, state and local government spending, and federal government spending that were partly offset by negative contributions from residential fixed investment and private inventory investment. Imports, which are a subtraction in the calculation of GDP, decreased.

Non-residential fixed investment decreased 3.1% in the 4th quarter. While nonresidential construction increased .8%, investments in equipment and software decreased (-)4.8%. There has been some discussion about how business will react to the decreasing profit environment going forward. Some are speculating the business will decrease investment. the 4th quarter number indicates this may be correct.

Inflation

The latest CPI and PPI reports indicate inflation is not under control. While it's not out of control, it is above the Fed's publicly stated preferred level of 1%-2%. This means the Fed will either be boxed in from a policy perspective and be unable to lower interest rates, or they will lower rates with the possibility that inflation may increase as a result of their lowering rates. Either way, the Fed is not in a good place.

From the latest CPI report:

On a seasonally adjusted basis, the CPI-U advanced 0.4 percent in February, following a 0.2 percent increase in January. Energy costs increased 0.9 percent in February after declining 1.5 percent in January. In February, the index for petroleum-based energy increased 0.3 percent and the index for energy services rose 1.5 percent. The food index rose 0.8 percent in February, following a 0.7 percent increase in January. Grocery store foods rose 1.1 percent, largely reflecting a 4.7 percent increase in the index for fruits and vegetables. The index for all items less food and energy advanced 0.2 percent in February, following a 0.3 percent rise in January; an increase in the index for shelter accounted for about one-half of the February advance.

Bernanke made the following comments about CPI in his latest Congressional testimony:

Let me now turn to the inflation situation. Overall consumer price inflation has come down since last year, primarily as a result of the deceleration of consumers’ energy costs. The consumer price index (CPI) increased 2.4 percent over the twelve months ending in

February, down from 3.6 percent a year earlier. Core inflation slowed modestly in the second half of last year, but recent readings have been somewhat elevated and the level of core inflation remains uncomfortably high. For example, core CPI inflation over the twelve months ending in February was 2.7 percent, up from 2.1 percent a year earlier. Another measure of core inflation that we monitor closely, based on the price index for personal consumption expenditures excluding food and energy, shows a similar pattern.

Notice the attention Bernanke gives to energy prices, which have increased over the last few months. This does not bode well for future CPI readings.

The economy isn't in a recession....yet. But the bad news keeps mounting. There is only so much an economy can make.

For economic commentary and analysis, go to the Bonddad Blog
Wednesday, March 28, 2007

Guess What? More Bad Housing News

Mar 28, 2007

By Bonddad
bonddad@prodigy.net

Don't blame me for this -- the news just keeps coming out. And the news has been uniformly bad for quite awhile. The people who have argued for a long time that housing was bottoming have been continually wrong about that bottom forming. Considering the large inventory overhang that exists and the tightening of credit standards currently underway across the country, expect this news to continue.

Federal authorities are investigating Beazer Homes on fraud.

Atlanta-based Beazer, the nation's sixth-largest residential homebuilder, rode high during the heyday of the housing boom—profiting from selling the homes it constructed and often financing the buyers as well through a wholly owned mortgage arm. It's common in the industry, but Beazer may have pushed the bounds: The North Carolina field offices of the Federal Bureau of Investigation, the Internal Revenue Service, and the Justice Dept. have recently opened a joint investigation into the company over such matters.

The Inspector General of Housing & Urban Development is also part of the group since a large percentage of Beazer's loans were made to low-income borrowers and insured by the federal government through the Government National Mortgage Assn., according to people familiar with the investigation.

"Actively Pursuing Fraud"

Investigators, however, are not limiting their probe to possible mortgage fraud. "There's all sorts of potential fraud issues here," FBI spokesman Ken Lucas told BusinessWeek. "We're looking at all types of [potential] fraud associated with Beazer—corporate, mortgage, investments."

Let's back-up through this story.

1.) Beazer is the 6th largest homebuilder in the country. This is not a regional, Mom and Pop operation.

2.) Three federal authorities are looking into this. At least publicly there don't appear to be any turf wars going on. That implies there are plenty of charges to go around.

3.) When an investigator says, ""There's all sorts of potential fraud issues here," you know you've got some serious problems.

More importantly, this news couldn't have come at a worse time. New homes sales dropped 3.9% last month. Inventories are at multi-year highs and sales are at multi-year lows. Now one of the largest homebuilders is being investigated. This casts a pall over the entire new home industry when it least needs a scandal.

From Bloomberg:

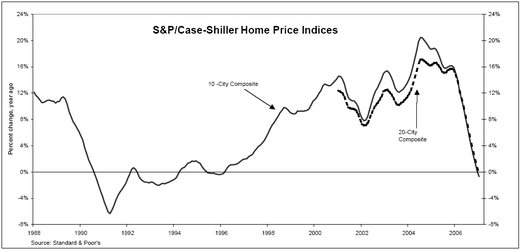
U.S. home prices fell in January for the first time in at least six years, a private report showed today.

A measure of home values in 20 metropolitan areas dropped 0.2 percent from the same month last year, according to the S&P/Case-Shiller home-price index. The decrease was the first since the group started keeping year-over-year records in January 2001.

The numbers follow a report yesterday that showed new-home sales at the lowest level in almost seven years as builders struggled with a glut of unsold dwellings. Falling prices make it harder for owners to borrow against home equity and may make lenders even more wary as delinquencies climb.

Today's data ``are a good indicator of the dire state of the U.S. residential real estate market,'' said Robert Shiller, chief economist at MacroMarkets LLC and a professor at Yale University.

This chart from the Big Picture Blog says it all:

Photo Sharing and Video Hosting at Photobucket

Finally, there is this assessment from the CEO of Lennar, another publicly trader housing company. It is from the blog Calculated Risk

"Let me begin by saying that these are difficult times for the home-building industry. We have recently completed our quarterly operation reviews with our division management team, and based on these extensive business plan and execution reviews, I can say first hand and with certainty that market conditions are very difficult across the country. As I listen to many of the leaders in the industry speak, that is our competitors and as I listen to economists and analyst and is investors, the message is becoming very unified and that is although we see some sporadic indications of firming in some markets, and we all look forward to seeing a firm foundation from which we can build forward, the reality is that market conditions are still challenging at best and in some markets continuing to deteriorate. Homes available for purchase has continued to climb while demand has been surely reduced. The market once driven by speculative build-up in demand and purchases that over the past years spurred more recent build up in inventory supply from speculators then put increased supply as they put homes back on the market and created the supply over hang and overall climate of customer caution.

These a very sobering comments, especially coming from an industry CEO.

There has been a literal deluge of bad housing news for the last few months. So far the economy has shaken it all off. But, I am wondering how much more the economy can take.


For economic commentary and analysis, go to the Bonddad Blog
Saturday, March 24, 2007

The Coming Mortgage Metldown, Pt. II

Editor's note: I have moved to post at the other blog(also see new articles below).
---
Mar 24, 2007
By Bonddad
bonddad@prodigy.net

Several months ago I finally broke down and got an online subscription to the Wall Street Journal and Barron's. For those of you who are unfamiliar, Barron's is a weekly financial publication that provides interviews, market analysis and editorials. This week they have a follow-up interview with Sy Jacobs, who first predicted the subprime mortgage problems in 2005. Below are excerpts from his interview (subscription required).

Some insist the problems in the subprime market are manageable.

The problems in subprime are not self-contained. It is a pinprick to a larger problem, and it needs to be looked at that way. The notion that subprime home-equity lending is somehow ring-fenced because it is only 12% of total mortgage loans outstanding and won't affect the rest of the mortgage and housing market is absurd. First of all, subprime lending was over 20% of 2006's volume. That tells you it was growing rapidly as a percentage of the mortgage business when it hit the wall.

The common argument coming from people against the subprime problem spreading is the subprime market is only "12% of the current market". Jacobs points out that in fact last year subprime mortgages were 20% of total mortgage underwriting. This means that a larger percentage of total mortgages sold last year were of lower quality. And this does not include the alt-A loans, which are above subprime quality but below prime credit quality. In other words, there are more problem loans out there than the 12% figure gives credit for.

How will the problems spread?

Mostly through housing. This year is going to be much worse than 2006 for mortgage and housing credit, and 2006 already laid the mortgage industry low. Nearly $700 billion of mortgages reset this year and nearly half of that is subprime. Remember 2004, when our esteemed former Federal Reserve chairman, Alan Greenspan, was exhorting us to take out adjustable-rate mortgages, the federal-funds rate was only 1% and had nowhere to go but up? Prime refinancing volume peaked in 2004, and the most popular loan product at that time was a 3/1 adjustable-rate mortgage, three years fixed and adjustable every year after that. Those are resetting this year after 17 quarter-point increases in the fed-funds rate. The subprime home-equity market peaked in 2005, and the most popular product from that year was a two-year-fixed, 28-year-floating mortgage. It resets this year, and now credit spreads are widening, Freddie Mac [ticker: FRE] is going to stop buying as much subprime, as are the capital markets in general, and a lot of capacity is exiting through bankruptcy courts.

First, I have seen to total amount of resetting mortgages this year at totals that range from $500 billion to a $1 trillion. That means we don't know how many are actually out there, but there are a ton of them that will reset this year.

Also notice that when people bought these loans, interest rates were incredibly low -- probably the lowest rates we'll see in out lifetime. Interest rates (The Fed Funds rate) have increased 4.25% since most of those loans were sold. That means a lot of borrowers are going to be in for some serious sticker shock.

Here is how the problem will spread through the housing market.

How bad is the credit crunch?

It is spilling into the secondary market in the sense that credit spreads in the secondary market have widened in the past few weeks. We're seeing a reversal in the appetite for risk that we've seen for the past several years. Credit will get more expensive across asset classes, and that's another way in which the subprime contagion will spread.

Let's back up through the eco-talk.

1.) "Credit spreads are increasing." OK -- here's what this mean. Interest rate products (bonds and loans) are measured against the US Treasury curve. Prices are quoted as "spread to the Treasury."

As the risk of a particular asset increases people sell that asset. Prices and yields move inversely; as prices drop, yields increase. To wrap this all up, as prices for mortgage-related products have dropped, their respective interest rates have increased. This means these products are now more expensive for borrowers because borrowing costs have increased.

Increasing interest rates obviously dries credit up because fewer people are willing to take out a loan at a higher interest rate.

2.) Credit standards are already tightening. That means the amount of subprime mortgage loans will decrease. While this is a good thing in the long run, it will act to decrease the number of potential buyers. This will act to lower home prices.

3.) As the number of subprime mortgage foreclosures increase housing inventory will increase. As I noted yesterday on my blog, the total number of existing homes in the for sale inventory has only decreased about 3% since last July. That means there are still a ton of homes on the market. And as foreclosures increase, the number of existing homes for sale will increase. This will add further downward pressure on prices.

So to sum up:

Tighter credit standards = fewer buyers = lower prices.

More foreclosures = more inventory = lower prices.

Update [2007-3-24 10:5:0 by bonddad]:: The Blog Calculated Risk has a great article on the housing supply and demand imbalance titled: "Housing: Supply Demand Imbalance". He explains the above points very well.

For economic commentary and analysis, go to the Bonddad Blog
Saturday, March 17, 2007

Why Are Food Prices Spiking?

Mar 17, 2007

By Bonddad
bonddad@prodigy.net

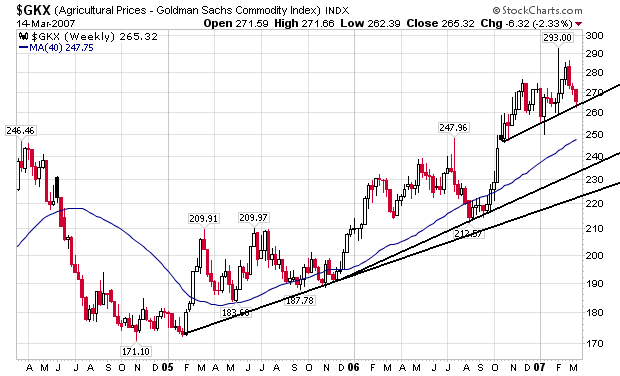
Last week the government released two inflation reports: the Producer Price Index and the Consumer Price Index. The PPI was released first. For the last three months, food prices at the producer level have increased 1.5%, 1.1% and 1.3% respectively. In the CPI report we learn that for the last three months food prices have increased .0%, .7% and .8%. These numbers are way above the trend so I looked at the CRB Agricultural Prices Chart. Here it is:

Photo Sharing and Video Hosting at Photobucket

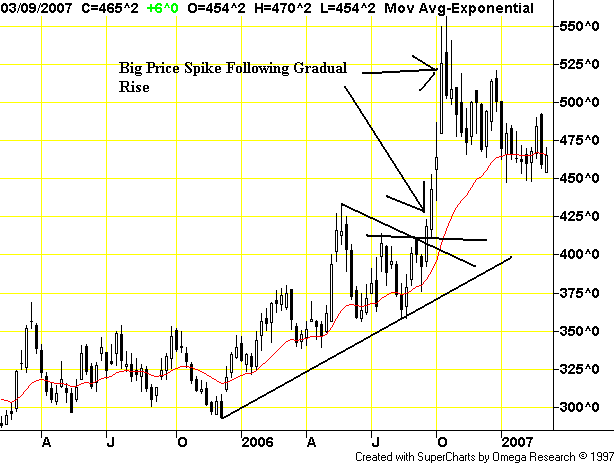
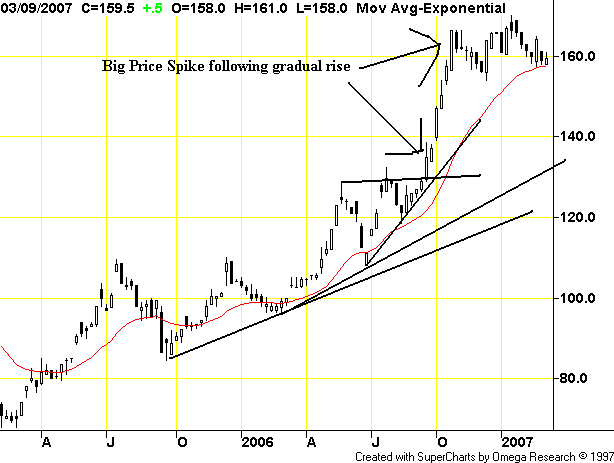
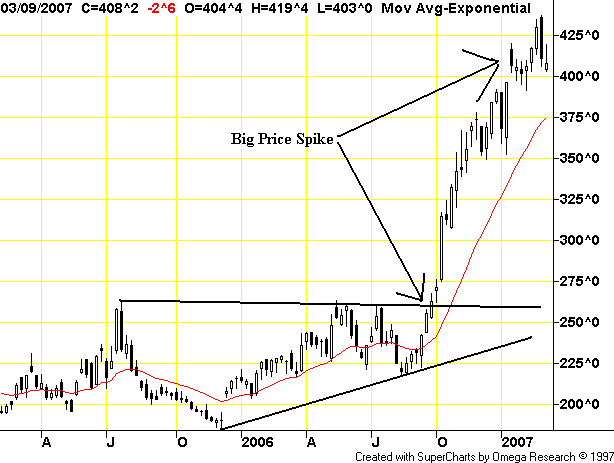
Here are the individual price charts for various grain commodities:

Wheat:

Photo Sharing and Video Hosting at Photobucket

Feed Wheat:

Photo Sharing and Video Hosting at Photobucket

Corn:

Photo Sharing and Video Hosting at Photobucket

Barley:

Photo Sharing and Video Hosting at Photobucket

All of these charts are at least 1 year in duration or longer. This indicates we aren't seeing seasonal fluctuations (which futures are suppose to prevent in the first place). So, what's happening with these prices?

The information below is from the the Department of Agriculture's World Agricultural Production Report

Total US wheat production has dropped from 58.74 million metric tons in 2004 to a projected 49.32 in March of 2007. That's a drop of 16%. Over the same period (2004 to Match 2007's yearly projection) all European countries have decreased wheat production as well. Australia -- which has been hit by a drought -- has seen production drop from 22.60 to 10.5 million metric tons. Overall world production has dropped from 628.59 million metric tons in 2004 to 593.11 million metric tons -- a decrease of 5.62%.

US and world production of course grains is also down. US production has dropped from 319 million metric tons in 2004 to a projected 280 million metric tons in 2007. That's a decrease of 12.2%. Overall world production has dropped from 1,014 million metric tons in 2004 to a projected 966 million metric tons in March 2007. That's a decrease of 4.73%.

And corn production is also down in the US and the world. Over the 2004 to the projection 2007 yield, US production has dropped from 300 million metric tons to a projected 2007 yield of 267 million metric tons (or 11%) while world production has dropped from 712 million metric tons in 2004 to a 2007 projected yield of 693 million metric tons (or 2.66%).

Simple economics states that declining supply = increasing price.

In addition, we have demand increasing from two areas. The first is simple population growth. As more people are born they will naturally want to eat. This obviously increases demand. In addition, there is a new element to demand: synthetic fuels. As the US adopts policies that promote ethanol and other food based fuels, demand increases which pulls prices higher.

Simple economics states that increasing demand = increasing prices.

In other words, we have two basic economic events (decreasing supply and increasing demand) pulling prices higher.

So what does all of this mean? Economically we have several issues:

1.) Inflationary pressures. Last year oil was the big inflation boogie-man. Now food prices may take their place. The charts above show the food prices are spiking. With overall production down over the last three years and a projected lower production level this year supply won't pick-up until next year. That means food based inflationary pressures may be with us for at least another year.

2.) Higher inflationary pressures means the Fed will be less inclined to lower interest rates. If the economy continues to slow, the Fed won't be able to provide monetary stimulus. That could exacerbate an economic slowdown.

3.) The economy has been growing for the 2004-2007 time period, yet food production is down. There may be a bigger problem lurking here.

Anyone who has any insight, please provide it.

Tuesday, March 13, 2007

Anatomy of a Subprime Mortgage Default

Mar 13, 2007

By Bonddad
bonddad@prodigey.net

There has been a ton of news lately about the subprime loan industry. But all of the news is a bit confusing -- what exactly is happening. Below I hope to explain exactly what is going on and why it's such a big problem.

From the WSJ:

Amid mounting defaults in the market for subprime mortgages, some big banks and mortgage companies are striking out in their efforts to wrest compensation from originators of those high-risk, high-return loans.

Led by HSBC Holdings PLC, banks and others are trying to force small mortgage lenders to buy back some of the same loans the banks eagerly bought in 2005 and 2006, by enforcing what the industry calls repurchase agreements. Squeezed by the onslaught of defaults, many originators are saying they can't afford to buy back their loans or are pursuing bankruptcy protection.

This is a standard part of the securitization industry. Here's how it generally works.

1.) Subprime company makes loan.

2.) Subprime company sells loan to larger bank.

3.) Larger bank pools loan with other, similar loans (same interest rate, same maturity etc....) and then sell pools to various investment groups (insurance companies, mutual funds etc...). Basically, the larger banks make one giant bond of all the loans they buy.

As part of step 2, the subprime originator agrees it will repurchase a loan under certain conditions, one of which is usually a specific delinquency rate.

Although the specifics vary from deal to deal, repurchase agreements obligate the mortgage originator, under some circumstances, to buy back a troubled loan sold to a bank or investor. That obligation sometimes kicks in if the borrower fails to make payments on the loan within the first few months or if there was fraud involved in obtaining the original mortgage. The total volume of mortgages nationwide that might meet those criteria isn't known, but such agreements cover billions of dollars in mortgages.

When a large number of loans go into delinquency early, the larger banks can flood the subprime originator with repurchase requests. This can bankrupt the subprime originator which is exactly what is happening right now.

This is why there have been so many problems in the subprime originators for the last few months.

New Century said yesterday that, starting last Wednesday, it had received a wave of default notices from its major Wall Street creditors, and may owe creditors a combined $8.4 billion for mortgage repurchases. It said if all its lenders demand repurchases, it can't afford to pay. That could force the company into bankruptcy proceedings, where it would join scores of others hurt by the industry meltdown.

That's a a whole lot of money. Considering New Century relies on lines of credit from the same large investment banks to finance its operations, New Century is obviously in a world of hurt.

Robert Napoli at Piper Jaffray said assuming a 20% loss rate on loans it is forced to buy back from its creditors, New Century "would have to absorb $1.6 billion of losses, essentially wiping out shareholders equity." As of Sept. 30, the company listed $25 billion in assets, about $23 billion in liabilities and $2 billion in shareholders' equity.

From a balance sheet perspective, this is a huge deal. Essentially, the owners/stockholders see their actual ownership interest wiped out overnight. Imagine if you were part owner of a company and you just woke up to discover your ownership interest -- which was pretty decent yesterday, is now worth nothing 24 hours later.

Loose credit standards are a prime culprit in the problems:

HSBC's borrowers included people who couldn't make their first mortgage payments as well as people who misrepresented their income or employment on their mortgage applications, interviews and HSBC's court filings show.

There's also a large amount of "whose left holding the bag" going on -- as in, who is being stuck with the loss.

When it is unable to claim its money or believes it will be unable to, HSBC must write off the loans. In 2006, the bank said the loan-impairment cost totaled $6.68 billion for its main U.S. consumer finance business. That was 34% higher than in 2005. The bank has said it may take two to three years to work through its problem loans.

HSBC's top finance chief acknowledges the difficulties in trying to enforce repurchase agreements. "It's proving quite difficult in the sense that many of the parties...don't have the wherewithal" to repurchase the loans, said HSBC Finance Director Douglas Flint.

Short version of all this -- it's a big damn mess.

For economic news and commentary, go to the Bonddad Blog

Saturday, March 3, 2007

Last Week's Financial Markets: What the Hell Happened?

March 3, 2007

By Bonddad
bonddad@prodigy.net


Below is a compilation of several posts on my blog. I've put these together in one mega-market post. I hope this helps to explain and assuage some fears out there.

The markets on Friday

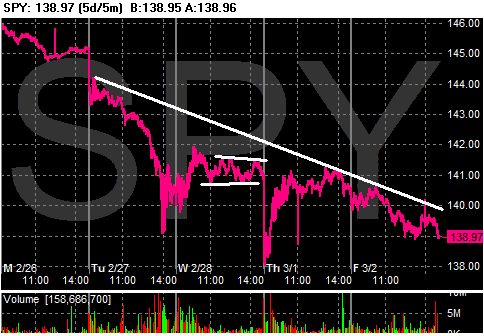
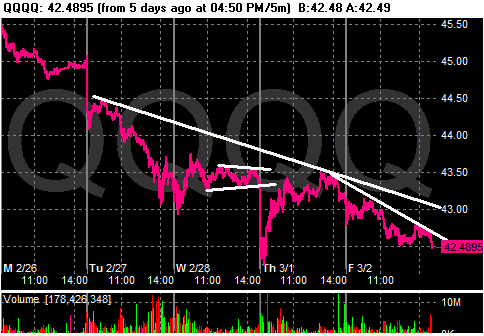
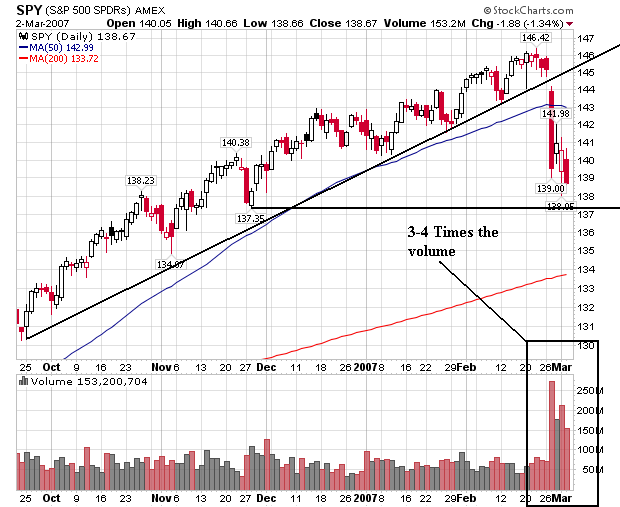
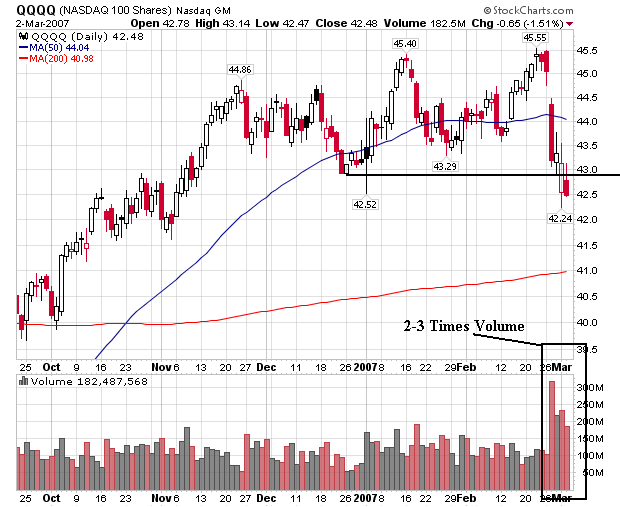
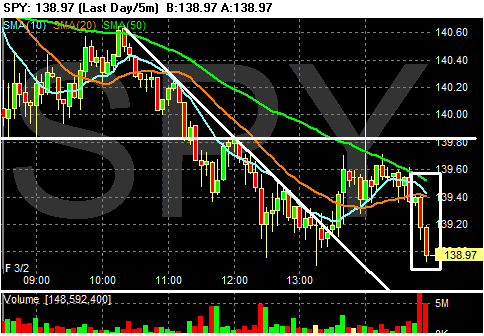
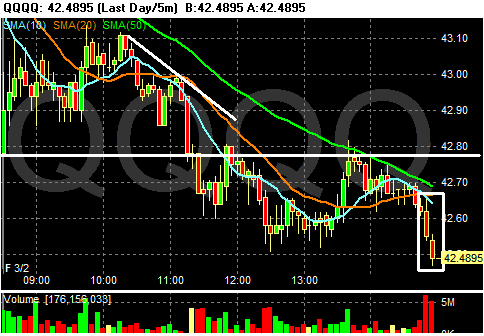
Traders don't want to hold anything over the weekend in this market. Take a look at the last two bars of both the SPYs and QQQQs -- there's a ton of volume and a strong downtrend. In addition, the markets closed near their lowest point of the day. This indicates there is some pretty strong bearishness in the market right now.

SPY:

Photobucket - Video and Image Hosting

QQQQ:

Photobucket - Video and Image Hosting

A review of the week and daily charts

From Bloomberg:

U.S. stocks dropped to a three-month low, completing their worst week since January 2003, after a decline in consumer confidence magnified the risk profit growth will be wiped out by a recession.

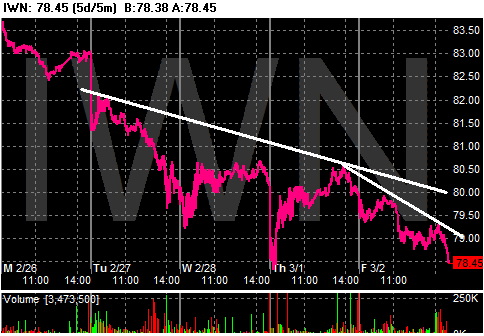
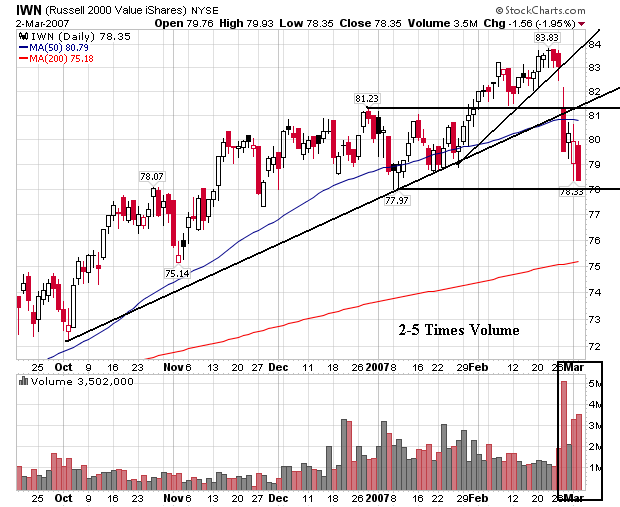
Let's go to the charts in the following order: SPY, QQQQ, IWN

Photobucket - Video and Image Hosting

Photobucket - Video and Image Hosting

Photobucket - Video and Image Hosting

These charts highlight four points.

1.) Tuesday was the big day of losses with a sudden drop at the open and continued weakness throughout the day.

2.) Friday we drifted downward and closed on a low-point.

3.) The overall trend for the week is down.

4.) You can literally draw a line from the upper left to the lower right of each chart and have the line represent the week's trend.

Let's go the the daily charts, courtesy of stockcharts.

Here's the SPY:

Photobucket - Video and Image Hosting

1.) There is a big jump in volume above the preceding 3-4 months. This indicates sellers were looking to get out.

2.) The index closed below the 50-day SMA.

3.) The index clearly broke the 6-month uptrend and broke through previous support levels.

Here's a chart for the QQQQs

Photobucket - Video and Image Hosting

1.) There are 4 days of heavy selling on between 2-3 times the normal volume for the preceding 3-4 months.

2.) The index closed below the 50 day SMA.

3.) The QQQQs have traded in a range between (roughly) 42.50 and 45.50 for the last three months. We closed below that range on Friday.

Here's a chart for the IWNs

Photobucket - Video and Image Hosting

1.) We had the heaviest selling of the indexes here -- up to 5 times the norm for the last 3-4 months.

2.) The index closed below the 50-day SMA.

3.) The index broke through two uptrends -- one that started at the beginning of October and one that started at the end of January.

All of these indexes had long red bars with large volume. This means sellers are in control and looking to book profits.

Fundamental Reasons for the Sell-off

1.) The BEA lowered GDP estimates from 3.5% to 2.2%. First, this is a large revision. People will make entirely different economic assumptions about an economy growing at a 3.5% growth rate than an economy at a 2.2% growth rate. Secondly, this is the third quarter of sub-par growth, indicating we are definitely in the cooling off stages.

2.) New Home sales dropped 16%. There is a high margin of error with this number, so it can be revised upwards. However, the initial reading put the "the housing market has bottomed" people out to pasture.

3.) Durable goods orders dropped 7.1%. Even without transportation, this number dropped 3.1%.

4.) Weekly unemployment claims are ticking up. The 4-week moving average increased from 327,000 on February 10 to 335,000 in the latest report. However, bear in mind this is a noisy report and is subject to revisions etc...

5.)While personal income increased (a net positive) the core PCE inflation level increased .2%. This takes away fuel to the "Fed will lower interest rates soon" argument.

6.) Construction spending dropped .8% in January. This adds further fuel to the slowing housing market story.

7.) While existing home sales increase last month they did so because of a 5% December to January price decrease, a 3.1% year-over-year price decrease, a 3% increase in the month-to-month inventory and a 23% increase in year-over-year inventory. In other words, the high inventory figures are starting to hit prices and we still have a ton of homes to sell.

8.) Countrywide Financial announced 20% of the subprime loans they service are late with payments. This indicates there is probably more trouble ahead for an already troubled part of the economy.

The Bullish Argument Going Forward

This is the Barron's cover story this week (subscription required). The article makes some good points.

Before Tuesday, every major stock market in the world -- and nearly all the smaller markets -- were near 52-week highs. Most markets also were near record levels, with the notable exceptions of the Nasdaq Composite and Standard & Poor's 500, a reflection of the absurd valuations they had reached in the tech boom of 2000.

.....

A bullish Wien thinks the S&P 500 could hit 1,600 by year end, a 15% gain. He says U.S. stocks look attractive with the S&P valued at 15 times projected 2007 operating earnings. The Dow Jones Industrial Average trades at 14.4 times estimated "07 profits. Both the Dow and the S&P 500 are in negative territory for the year, with the industrials off 2.8% and the S&P 500 down 2.2%. The so-called earnings yield on both the S&P 500 and the Dow is close to 7%, which compares favorably with the 4.5% yield on 10-year Treasuries. The earnings yield is the inverse of the market's price-earnings ratio.

Companies continue to lift dividends and repurchase record amounts of stock in order to reward shareholders -- and stay out of the sights of private-equity shops on the prowl for new leveraged buyouts.

.....

HISTORY SUGGESTS THAT STOCKS MAY DO WELL in the next two months. There have been 38 days since 1979 when the S&P 500 has suffered a single-session loss of 3% or more. The average gain in the ensuing 60 days has been 6.9%, with the index rising in 31 of the 38 cases, according to Citigroup research.

There are some very solid technical arguments here. First, the market isn't cheap but certainly not expensive by historical standards. While corporate profit growth is expected to slow, it is still pretty healthy. And traders are conditioned to buy on dips, meaning there could be some buying nibbles at attractive technical levels over the next few weeks.

The article does state overall slowing economic growth is the primary reason the markets may not advance. This is a strong counter-argument. As I wrote above, there was a ton of bad economic news last week that provided the fundamental reason for the continued market weakness throughout the week. I think the market is starting to price in the slower growth scenario going forward.

I still think housing is the main wild card going forward. There is still a ton of inventory to clear and last week's numbers indicate it will take lower priced to do it. Housing starts are slowing, which means we will probably have a large amount of construction lay-offs in the coming months. However, the business construction sector may absorb some of these displaced workers if non-residential construction levels continue at current levels.

I wouldn't be surprised to see the market far more sensitive to bad economic news over the next few weeks. Up until last week, the market was able to shrug off some bad news, basically arguing that problems were contained within specific market sectors -- especially housing problems. However, I think we'll start to see some of housing issues -- especially in the mortgage area -- start to spread-out to other market sectors like financials (mortgage related issues) and consumer durables (furniture/appliances).

Food for thought

Friday, February 23, 2007

Third Way Project: A Pack of Economic Lies

Feb 23, 2007

By Bonddad
bonddad@prodigy.net

There's a new centrist group out called the Third Way Project. While I am all for a centrist approach on most points -- largely because I am a centrist -- their analysis has more in common with a Larry Kudlow "analysis" then a serious policy paper. Below I will explain why.

Debt

The Third Way Project (TWP) focuses on the increase in mortgage debt and argues, "much of this new debnt is mortgage debt, and most families would consider buying a house an investment, not a negative event."

However, this is an overly simplistic explanation of the overall problem. First, the total amount of household debt in the US economy is at incredibly high levels. According to the Federal Reserve’s Flow of Funds statement, total household debt outstanding is $12.5 trillion dollars. This is over 90% of the total US GDP and over 120% of disposable income.

Photobucket - Video and Image Hosting

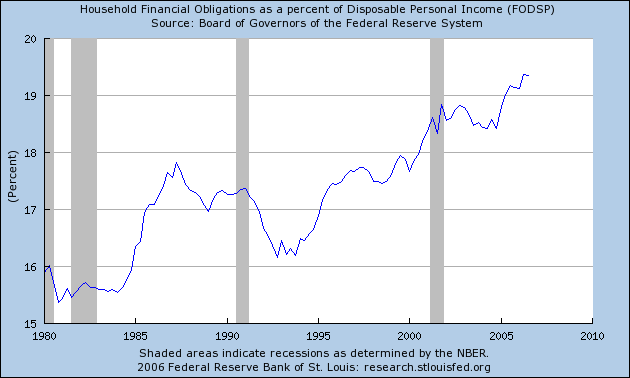
Debt payments as a percentage of total income are at record levels.

Photobucket - Video and Image Hosting

According to the St. Louis Federal Reserve’s FRED economic data system, the year-over-year increase in total debt acquisition by US households is over 10% for this expansion – nearly twice the level as the expansion in the 1990s.

Photobucket - Video and Image Hosting

Also according to the FRED system, total homeowner’s equity at the national level is at record lows.

In short – the US is drowning in debt. There is no other way to spin these numbers.

The TWP uses the classic household net worth argument to justify these levels of debt. Household net worth at the national level is also from the Fed’s Flow of Funds statement, and is essentially a tally of all household assets and debts at the national level. While household net worth has increased during this expansion, the TWP fails to take the extreme stratification of wealth into account. As the FDIC noted

While there is no definitive standard for how much a person needs for retirement, many baby boomers appear to have a net worth insufficient to meet basic retirement needs, according to some guidelines.9 In 2004, the median net worth for families headed by baby boomers between the ages of 45 and 54 was $144,700.10 However, these data are somewhat difficult to interpret, as wealth holdings in the United States are skewed toward the top 10 percent of families (see Chart 3, next page). The median family net worth was $1,700 for the lowest 25 percent of U.S. households and $43,600 for those in the 25th to 49th percentile. In contrast, those in the 75th to 89th percentile had median family net worth of $506,800, while the figure for those in the top 10 percent was $1.4 million. These data do not apply only to baby boomers, however. Chart 3 suggests that although many families have a fairly substantial amount of assets, a large number have few resources with which to supplement retirement income.

In other words, incomes at the top 10% of the income ladder are largely responsible for the great totals.

Savings

See the above statement from the FDIC regarding wealth holding. In addition, A Boston College Study concluded

A new retirement study provides further evidence that a growing number of Americans are at risk of a diminished standard of living once they stop working.

The Center for Retirement Research's new retirement-risk index, released Tuesday, shows 43% of working households were in danger in 2004 of having too little income to fund their retirement.

But the study probably understates the proportion of retirees at risk. Its projections assume that people retire at age 65, cash in on their home equity through a "reverse mortgage" and exchange their assets for a stream of income by buying an immediate annuity.

Yet many people retire before 65, according to the center, and don't necessarily buy immediate annuities or take out reverse mortgages. Nor does the research take in account the "wild card" of health care costs — and how these expenses will affect retirees' standards of living, says Alicia Munnell, director of the center at Boston College.

The percentage of "at risk" households has surged in the past two decades, from 31% in 1983, according to the center's analysis, which was funded by Nationwide Mutual Insurance. Two factors that have raised the risks are the growing uncertainty of Social Security payouts and the increasing burden on employees to save for their own retirements.

The index, which uses data from the Federal Reserve, is part of a stream of recent sobering conclusions about workers' abilities to finance their golden years. The studies come as the first of 79 million baby boomers — the generation born from 1946 to 1964 — are turning 60 this year.

And finally, there is this study from the Employee Benefit Research Group. It found that 63% of people have less than $100,000 saved for retirement. The paltry savings levels reported in the Flow of Funds report backs-up this fact. $100,000 is clearly insufficient to provide for income for a 20-year period, even with social security.

TWP also wants to include a variety of items in savings that frankly make no sense. First, they want to include home equity totals. As noted above, home equity is currently at a 50 year low. Secondly, households must go into debt to tap equity. As noted above, household dent levels are already at record levels. Investing in college tuition and corporate research and development is not savings. These are investments. In addition – the TWP does not mention that college debt payments are also a primary reason why college graduates are having difficulty moving up the socio-economic ladder. As for the inclusion of "sweat equity" – investment in a business, this figure is already included in national income figures. The attempt at including these figures is a classic trick of the right wing noise machine – whenever you don’t like an economic number, change it’s definition to make it look better.

Income

Let’s start with a few facts from the Bureau of Labor Statistics. The TWC uses 1974 as a starting point on wages. In January 1974, the average housely wage of production workers was $4.26. This figure was $17.09 in January of 2007, for an increase of 301%. Over the same time period, the inflation level increased from 46.6 to 202.416, for an increase of 334%. That means that wages have actually decreased since 1974 in inflation adjusted terms.

In addition, the Gini Index (a measure of income inequality) increased from .39 to .46 from 1974 to 2001. This means that income inequality has increased over the time frame the TWP sites.

TWP’s statements also provide their own rebuttal.

TWP concedes:

"It is true that much (but not all) of household income gain can be attributed to wives working more,, but neopopulists see the increased female workload in an entirely negative context and as a burden on women and families. We suspect many working-women want to work.

Translation: family incomes haven’t increased because wages have increased. Instead family wages have increased because more people in the family are working. I am not making this statement to disparage anybody who wants to work. However, as the number of people entering the workforce has increased, average hourly earnings (as stated above) have decreased.

In addition, TWP also notes – in their own study – that incomes in the 90th percentile have increased nearly twice as fast as incomes in the 50th percentile. In short – the rich are increasing their wages at twice the level as those in the middle.

And finally, there are these points from Lou Dobbs:

The middle class is also working more hours than ever before: Thirty years ago Americans worked an average of 43 weeks, but now U.S. workers are putting in an average of 47 weeks per year, according to the Bureau of Labor Statistics. That's in stark contrast to the rest of the industrialized world, where the number of hours worked in all other countries except for Canada has decreased over the past 30 years, the Organization for Economic Cooperation and Development reported.

About one-third of the families in this country bring in less than $35,000 of income each year, according to the Census Bureau, a figure that's nowhere close to ensuring the quality of life and standard of living to which many Americans have grown accustomed. I fear the American Dream may finally become the American Pipe Dream.

These families at the bottom of the wage scale are really struggling. According to the Federal Reserve's most recent comprehensive Survey of Consumer Finances (released every three years), average family income from 2001 to 2004 fell 2.3 percent, and the median net worth of the bottom 40 percent of families declined as well. And real median wages declined by more than 6 percent during the same period.

While these guys do get an A for effort for trying to find the middle ground, they instead are siding with Republican spin. Better luck next time.

Tuesday, February 13, 2007

The 5 Fundamental Problems of the US Economy Hotlist

Feb 13, 2007

By Bonddad
bonddad@prodigy.net

I've been bearish on the economy for the last two years. Every 4-6 months, I revisit my bearishness to see if it is still warranted. It is. Underlying the great and fabulous growth of the "greatest story never told (according the Larry Kudlow) is a mountain of debt at the federal and personal level, stagnating wages a negative national savings rate and a trade deficit that while showing some signs of improvement is still at dangerous levels.

The standard refrain regarding this points is "nothing bad has happened yet. Therefore we shouldn't worry about these things." While it is true that nothing bad has happened, we have to ask ourselves a fundamental question: "Is this the way we want to build and manage the largest economy in the world?"

Debt

When used properly, debt can increase leverage and allow an investor to increase his return. When used poorly, debt is a crutch that hides the basic problems of an economy. Unfortunately, the US is using debt poorly at the federal and household level.

At the federal level we have once again seen an explosion of debt issuance. While the White House is claiming the budget deficit is decreasing, the amount of debt issued for the last 6 years indicates otherwise. According to the Treasury Department, the total debt outstanding on September 30 2001 was $5,807,463,412,200.06. That number was $8,713,570,341,089.42 as of February 12, or an increase of nearly $3 trillion dollars. The amount of interest on that debt is increasing:

2006 $405,872,109,315.83
2005 $352,350,252,507.90
2004 $321,566,323,971.29
2003 $318,148,529,151.51
2002 $332,536,958,599.42
2001 $359,507,635,242.41

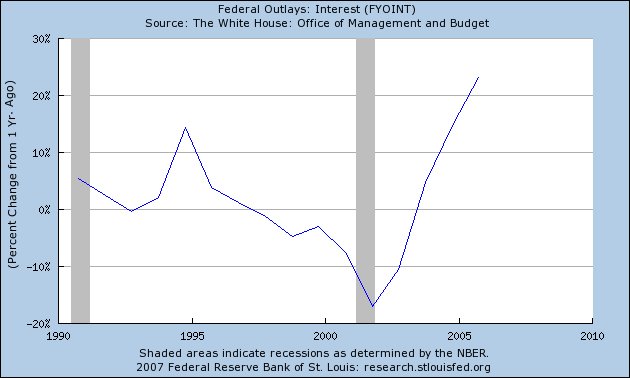
Here is a chart from the St. Louis Federal Reserve that shows the year-over-year increase in interest payments.

Photobucket - Video and Image Hosting

As we enter a period when higher interest rates are more likely simply because rates have been at generational lows for the last 4 years, these number will obviously go higher.

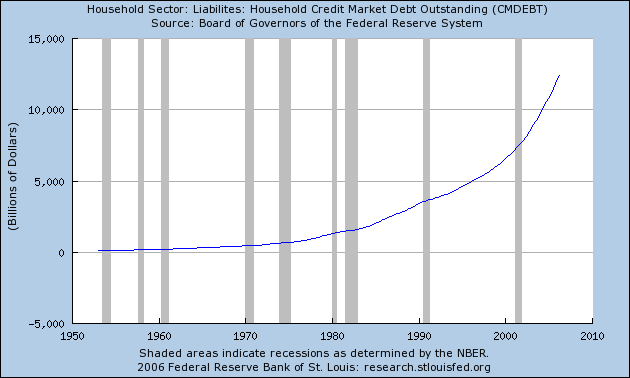
At the household level we have also seen an explosion of debt use, especially in the last 5 years. Here's a chart of total household debt outstanding from the St. Louis Federal Reserve:

Photobucket - Video and Image Hosting

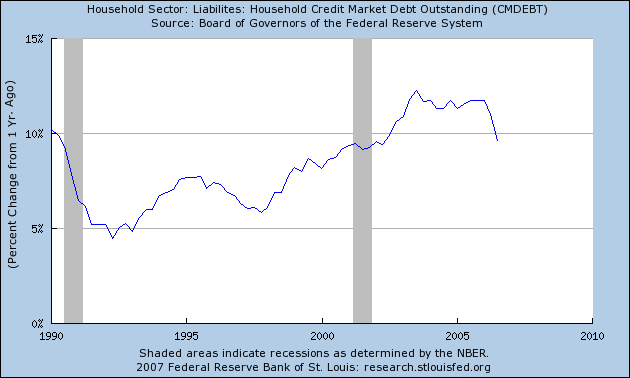
Notice the higher arc of the last few years that occurred during this expansion. The next chart shows how the year over year change in household debt is twice as high during this expansion as the previous expansion.

Photobucket - Video and Image Hosting

The following chart shows how total debt service payments are at record highs of disposable income.

Photobucket - Video and Image Hosting

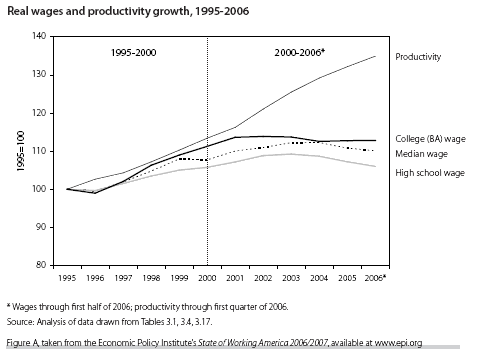
All of this has occurred at a time when wages for most Americans have been stagnant, despite some large productivity increases we have seen (thanks to Tula Connell for the graph).

Photobucket - Video and Image Hosting

So, the great increase in the standard of living has not come from higher wages, but instead by borrowing today in hopes of repayment tomorrow.

Stagnant Wages

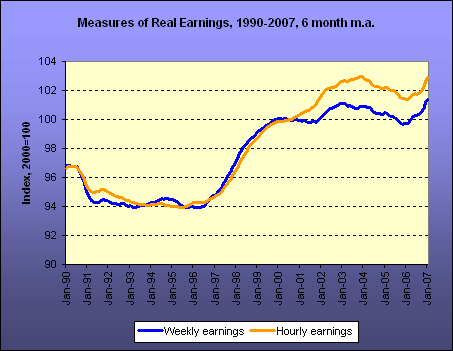
In case you were wondering, the graph above indicates that wages for the average American have been stagnant for the last 6 years as well. Here's another graph from Kash at the Streetlight economic blog

Photobucket - Video and Image Hosting

Here's how he sums up the chart:

In recent months the drop in gas prices has pushed real earnings noticeably higher, but those earnings are still only around 2% above where they were seven years ago.

So after accounting for consumer price inflation, the average production worker takes home about $10 more per week than he or she did in the year 2000. It's no wonder that lots of people feel that economic growth is passing them by...

Savings (or lack therefor).

So, what happens when a person with all of this debt loses his job? Well, there isn't much to fall back on. Here is a chart from the St. Louis Fed that shows the national savings rate:

Photobucket - Video and Image Hosting

There has been a fair amount of ink devoted to proving the official savings rate is not a good measure. Unfortunately for this argument, three other studies have confirmed the savings crisis is very real. The short version is simple: one financial catastrophe and the average American family is knee-deep in trouble.

The trade deficit

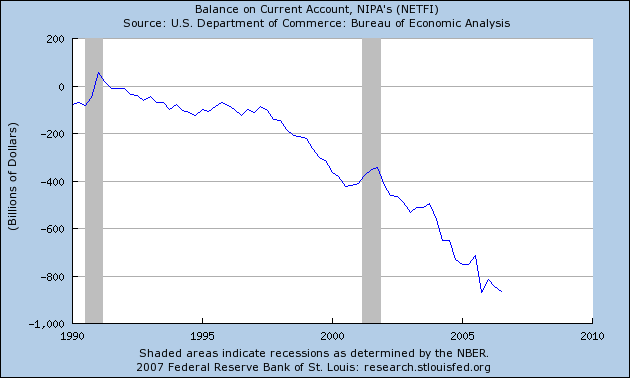
The US is consuming more than it produces. We buy far more goods than we sell, as evidenced by the mammoth US trade deficit:

Photobucket - Video and Image Hosting

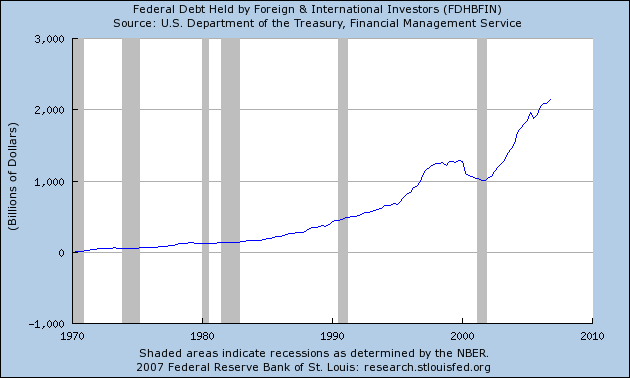
The trade deficit is a primary reason why foreign investors have almost doubled their investments in US debt securities over the last 5 years.

Photobucket - Video and Image Hosting

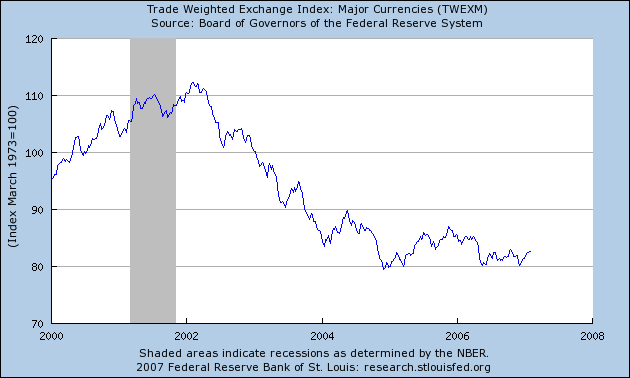
Like the savings situation, some have tried to argue the deficit isn't a problem because either nothing bad has happened yet or this calculation is wrong or a combination of both. The problem with this argument is the forex market clearly disagrees, as they have sent the dollar on a four-year long downward trajectory.

Photobucket - Video and Image Hosting

Conclusion

So where does this leave the economy? Massively in debt and vulnerable to random events. Now we can bury our heads in the sand or try to claim that "something is fundamentally different with this current situation" that makes standard economic analysis fruitless, or we can start to change the way we conduct business.

But then again, nothing bad has happened yet, so why worry?

For economic commentary and analysis, go to the bonddad blog.

Tuesday, January 30, 2007

Housing Market Excess Supply 1 Mil

Jan 30, 2006

By Bonddad
bonddad@prodigy.net

From CBS.Marketwatch.

The number of vacant homes waiting to be sold surged 34% to 2.1 million at the end of 2006 compared with the end of 2005, by far the fastest increase ever recorded, the Census Bureau reported Monday.

A year ago, 1.57 million homes were vacant and awaiting a sale.

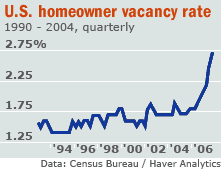
The vacancy rate for owned units jumped to a record 2.7% from 2.0% a year earlier. From 1965 to 2005, the homeowner vacancy rate had never been above 2%. The long-term average is 1.4%.

First, note the long-term average is 1.4%. So the current market is way above the long-term average. Also note the average has never been above 2 million units. Again, we're way above the long-term average on that as well.

Here's the chart that accompanied the article. Notice the rather large spike in the vacancy rate:

Photobucket - Video and Image Hosting

That spike is really large and indicates there is a fundamental problem in the market from the supply side of the equation.

First of all, let's see what we are measuring. Here is the Census Bureau's definition of vacant home:

A housing unit is vacant if no one is living in it at the time of the interview, unless its occupants are only temporarily absent. In addition, a vacant unit may be one which is entirely occupied by persons who have a usual residence elsewhere. New units not yet occupied are classified as vacant housing units if construction has reached a point where all exterior windows and doors are installed and final usable floors are in place.

Basically, these are free-standing houses no one is currently living in. In addition, notice the second part of the definition: "vacant unit may be one which is entirely occupied by persons who have a usual residence elsewhere. That part of the definition would encompass flippers, or people who purchased homes with the intention of quickly reselling them.

Overall, here's the basic problem:

"We have more than a million housing units of excess supply," said James O'Sullivan, an economist for UBS. "If you are looking for evidence that the worst is over for housing, you're not going to find it in this report. This argues that housing starts need to go down more."

In 2006, the number of housing units in the United States rose by 2.14 million, or 1.7%, to 126.7 million. The number of units occupied, however, rose by less than half as much -- 1.04 million.

Meanwhile, the homeownership rate (the percentage of homes occupied by their owners) was essentially steady at 68.9%, the government said, close to the all-time high of 69.3%.

Last year the number of units increased by a little over two million, while the number of occupied units increased half as much. Econ 101: excess supply = decreasing price. Or, we still probably have a way to go before housing hits bottom.

For market commentary and analysis, go to the Bonddad Blog
Saturday, January 27, 2007

FINALLY -- Senate Investigates Credit Card Industry

Jan 27, 2007

By Bonddad
bonddad@prodigy.net

For the last two years I have been writing about -- and complaining about and warning about -- the massive amount of debt in the US economy. Now that we have Democrats in the majority it looks like we are finally going to get some action on the more questionable credit card practices. The Senate Banking Committe is holding hearings on various credit card industry practices. Below are some of Senator Dodd's opening statements.

Let's look at some raw numbers.

Credit card use has grown dramatically over recent years. Over 640 million credit cards issued by more than 6000 credit card issuers are currently in circulation. Between 1980 and 2005, the amount that American consumers charged to their cards grew from an estimated $69 billion per year to more than $1.8 trillion.

Let's simply think about those figures for a minute. Assuming a population of 300 million and say 20%-25% under the age of 18 (although that doesn't mean the kids don't have cards) that at least 2 cards per person, and probably more. I think it's safe to assume that every American who could have a credit card has one. In other words -- credit is readily available to everyone.

The present level of credit card debt in the United States is at record heights. Total consumer debt in America is nearly $2.4 trillion. Out of that, $872 billion is revolving debt, which is essentially credit card debt. The average American household has over $9,300 worth of credit card debt. Let me repeat that. The average family living in the United States has over $9,300 of credit card debt. In comparison, the median household income was about $46,000 in 2005.

Additionally, Americans have never paid more in interest, paying nearly 15 percent of their disposable income on interest payments alone, despite the current historically low interest rate environment.

It's about time someone in a position to influence policy started to talk about debt, because it is the engine of the current US economy. The average American has credit card debt equal to 20% of national median income. That's before we get into mortgage debt (which is another story altogether). That's a ton of debt. And that's the average. That means there are cases out there that are far worse.

In addition, Dodd makes a great point about regardless of the current record low interest rate environment, Americans are sending 15% of their income to credit card companies in the form of interest payments -- payments that do nothing to reduce the principal amount of their debt. That is a pretty scary figure.

Another area which I believe deserves examination is the massive increase and targeting of credit card solicitations. According to the Federal Reserve, an estimated 6.05 billion direct mail solicitations were sent by credit card issuers in 2005 alone.

Many of the solicitations target students, persons currently on the economic edge, senior citizens on fixed incomes, and persons who have recently had their debts discharged in bankruptcy. I have long believed that we have an added responsibility to protect the most vulnerable in our society – and I believe that examining the targeting of these groups is critically important.

OK -- here we get into a very tricky area where we have to balance personal responsibility with corporate responsibility. Yes -- people have to be responsible with their money. However, consider a person on limited income who suddenly has a really big medical payment. At the same time, they receive a credit card application. Don't think it can happen? Well -- according to the Federal Reserve statistic cited above every US resident received one credit card solicitation by mail per month in 2005.

It's also easy to see the following chain of events. Companies deliberately target vulnerable consumers who run up tons of debt and then the same companies ram rod a bankruptcy "reform" package through Congress that literally makes indentured servants out of credit card holders.

Short version -- this is a story that cuts both ways.

I also have concerns with the amount, type, and disclosure of certain fees imposed on consumers. Over the past 2 years alone, the amount of money generated by credit card fees has simply skyrocketed. In fact, the term ``skyrocketed'' may be something of an understatement.

Banks are expected to collect a record $17.1 billion from credit card penalty fees from 2006, a 15.5% rise from 2004 (according to R.K. Hammer, a bank-advisory firm, as cited in USA Today). This is a tenfold increase from 1996, when card companies raised $1.7 billion in revenues from fees.

We need to take a close look at these fees and how they fundamentally impact consumers.

We must closely examine the current disclosure regime. The current system of disclosure is outdated, has not kept pace with the variety of credit card practices, and consumers have little understanding of the terms and conditions of their credit card contracts. Despite the significant work of many– including a number of the members of this Committee-- to provide consumers with clear, understandable, and consistent information, consumers are increasingly becoming confused and intimidated.

Ah yes -- those credit card fees. Miss one payment and the interest rate goes to 30%+. That's a scenario that has happened to practically everybody I know. And the actual Credit Card disclosures on these topics are at best poorly written.

n addition, the OCC issued an advisory letter in September 2004 to alert national banks to the agency’s concerns regarding certain credit card marketing and account management practices. The OCC’s letter outlines three credit card practices that "may entail unfair or deceptive acts or practices and may expose a bank to compliance and reputation risks. While the OCC has deemed these practices "unfair and deceptive," the agency has to this point declined to prohibit them. With the increase in the pervasiveness of credit cards and the number of consumers who utilize them, the OCC in my view should recommit itself to protecting consumers.

You mean credit card companies might engage in questionable marketing practices? Say it isn't so! And the Bush administration hasn't done anything about it? I'm shocked!

Seriously -- it's about time we looked at these companies' practices. And while Dodd is obviously looking to get some press for his presidential run with these hearings, it's still a really good thing to see. This is something I'm going to try and follow for however long it goes on.

Update [2007-1-27 12:10:1 by bonddad]:: Thanks to Silver Oz below for pointing out this article. You'll notice that Senator Dodd used the average CC debt figure of $9300. According to this article:

Most of the people citing the $8,000 figure credit it to CardWeb.com, a service that tracks credit card trends.

CardWeb, however, doesn’t contend that the average American owes more than $8,000 on cards. Their statistics show that the average debt per American household with at least one credit card was $8,940 in 2002, the last year for which figures are available.

To get that number, CardWeb simply divided the total outstanding credit card debt at the end of 2002 -- $750.9 billion -- by the 84 million American households that it says have at least one credit card. (CardWeb uses a slightly different definition of household than the Fed does. And the company contends that 80% of households, rather than the Fed’s 76.2%, have at least one credit card.)

This article notes that the Credit Card debt problem is more concentrated.

* More than a third -- 36% -- of those who owe more than $10,000 on their cards have household incomes under $50,000, according to the VIP Forum analysis.
* 13% who owe that much have household incomes under $30,000.
* The percentage of disposable income used to pay debts is still near record highs.
* The median value of total outstanding debt owed by households rose 9.6% between 1998 and 2001.
* Bankruptcies set another record in 2003, with 1.6 million personal filings, the American Bankruptcy Institute reports.

For economic analysis and commentary, go to the Bonddad Blog
Tuesday, January 16, 2007

Housing Bottom? Not With News Like This: Bonddad

Jan 16, 2006

By Bonddad
bonddad@prodigy.net

This week earnings season begins on Wall Street. Unfortunately for homebuilders, the news has been pretty bad. Economists who are calling for a bottom in housing will argue that companies are loading all of the bad news into one quarter. Basically, companies know they already have a bad quarter on the books, so they go ahead and take a bunch of charges they would have to take anyway. However, we're seeing a ton of bad news come out in one quarter. It's difficult to think this is simply a mass move to write-off certain issues.

Centex Homes has big write-off

The Dallas-based company said it expects to lose $2 a share from continuing operations for the third quarter ended Dec. 31, hit by a $300 million land valuation adjustment and $150 million of option deposit and preacquisition walkaway costs. The quarter will also included a $60 million provision tied to a federal tax audit.

Excluding those costs, Centex expects to make 75 cents a share for the quarter, shy of the 81-cent Thomson Financial target.

The company says closings dropped 12% from a year ago in the third quarter, while orders slid 24%.

"We are navigating through one of the most challenging housing environments in the past 25 years," said CEO Tim Eller. "We are responding by reducing our land position and inventory, aligning our workforce to the current sales pace, and improving our overall cost structure."

Dominion Home Sales Drop 43%

The number of houses delivered for the quarter dropped 50.2 percent to 284, from 571 units a year earlier.

For the year, Dominion said it sold 1,171 houses with an aggregate value of $219.1 million, a 39.7 percent drop from 1,944 units with a total value of $370.6 million in 2005.

The company, which builds single-family housing in Central Ohio and Louisville and Lexington, Ky., delivered 1,335 houses last year, down 37.8 percent from 2,146 delivered in 2005.

Palm Harbor and M/I Homes report drops

M/I Homes Inc. Thursday said new contracts for the quarter ended Dec. 31 fell 61% from a year earlier to 353 homes.

The Columbus, Ohio-based home builder said its cancellation rate rose to 63% in the fourth quarter from 27% in the year-ago period, and from 42% in the third quarter. More buyers have been backing out as prices fall and as they experience more difficulty selling their existing homes.

...
Late Wednesday, factory-built home provider Palm Harbor Homes Inc. warned it expects to post a loss in its fiscal third quarter ended Dec. 29.

Chief Executive Larry Keener in a prepared statement said the manufactured-home industry "has continued to decline through the second half of calendar 2006, resulting in the weakest year for total factory-built housing shipments in history."

The Dallas company said it projects unit shipments for factory-built housing for 2006 were 156,000 to 158,000 homes, about a 17% decline from the prior year.

DR Horton and Meritage Homes report losses

n an indication that the housing sector has yet to reach a bottom, D.R. Horton and Meritage Homes both posted lower quarterly sales yesterday. D.R. Horton reported net sales orders of $2.3 billion for fiscal Q1, nearly $1 billion below last year's figure and widely missing Street forecasts of $2.74 billion. Cancellations came in at 33% -- not good, but better than last quarter's 40%. Horton has resisted offering incentives but has recently been compelled to discount properties, a move that will hurt profit margins.

Meritage reported net sales of $356 million in Q4, down precipitously from last year's $723 million. Q4 revenue was also down at $821 million versus $1.04 billion a year earlier, but this figure beat forecasts of $742.3 million. Neither company's shares took much of a hit on the news since the market had priced in its low expectations. Both Horton and Meritage are trading about 40% off their 12-month
highs.

And new home sales are probably overstated by as much as 20%:

New-home sales are tallied by the Census Bureau, based on a sampling of contracts signed by home buyers. Running at a pace of more than one million a year for the last four years, new-home sales have been a significant contributor to the housing boom — and to the economy. (Existing-home sales, reported monthly by the National Association of Realtors, count actual closings.)

But here’s the rub: If a contract to buy a home, signed in November, is canceled in December, the Census Bureau does not subtract the failed transaction from the number of sales, or add the house back to its inventory total. In the last year, as the housing market has cooled, the volume of cancellations has risen to epidemic proportions.

...

And so, in the quarter ended on Oct. 31, Toll Brothers, the high-end home builder, noted that cancellations totaled 37 percent of contracts signed in the quarter, up from 18 percent in the same quarter the previous year. Pulte Homes, the builder based in Bloomfield Hills, Mich., reported a 36 percent cancellation rate in its third quarter, up from 17 percent in the 2005 third quarter.

"Cancellations have really affected big, publicly held builders the most, because they are relatively heavily concentrated in what had been the hottest markets," said Dave Seiders, chief economist at the National Association of Home Builders. Basing his findings on a survey of 30 large builders, Mr. Seiders concluded that in November 2006, cancellations constituted 38 percent of gross sales, compared with 26 percent in November 2005 and about 18 percent in the first half of 2005.

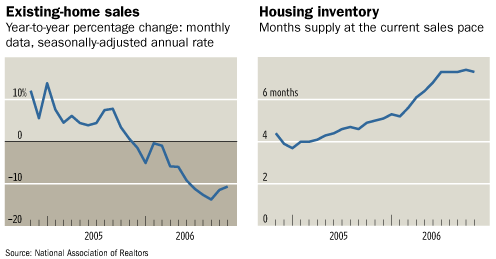
Here's the basic problem: demand is decreasing and supply is high.

Photobucket - Video and Image Hosting

Lower demand = lower prices.

Higher supply = lower prices.

Put the two together, and you get lower prices.

This isn't over yet -- not by a long-shot.

Update [2007-1-16 11:2:59 by bonddad]:: From Bloomberg, KB Home has a bad quarter:

Los Angeles-based KB Home said in a U.S. Securities and Exchange Commission filing its charges will affect earnings for the fiscal fourth quarter ended Nov. 30.

The company said on Dec. 8 that it would take a charge of $235 million to $285 million against its housing stock. The cost of exiting land purchases was estimated at $90 million at that time.

For economic and market commentary, go to the Bonddad Blog
Saturday, January 6, 2007

Is Copper Signaling a Recession?

Jan 6, 2006

By Bonddad
bonddad@prodigy.net


From CBS MarketWatch

A sell-off in commodities -- from copper to crude oil -- over the past few sessions is telling some veteran market watchers that a slowdown in economic growth, likely one of considerable magnitude, is already underway.

In the last two days alone, commodity prices seem to have fallen off a cliff. Copper futures, which tumbled 7.7% on Wednesday, fell another 1.8% on Thursday -- and have dropped 27% from their December highs.

Crude-oil prices fell nearly 5%, following a 4% drop in the previous session. The front-month futures contract was trading at its lowest level since June 2005. See Futures Movers.

Here's a daily copper chart. The price has gapped down and continued downward last week:

Photobucket - Video and Image Hosting

The reason copper is predictive?

Most commodities are used in the production of industrial goods. When producers start demanding fewer raw materials, it becomes noticeable in commodities prices much earlier than in official economic statistics, explained Barry Ritholtz, chief market strategist at Ritholtz Research & Analytics.

Copper, in particular, is often used as a reliable economic indicator because of its widespread use in production.

"Copper is the metal with a Ph. D. in economics," Ritholtz said. "It's used in the wiring of homes and offices, in plumbing in construction, and it's also a key component in electronic goods.

High stockpiles are one of the reason for the drop in copper prices:

Stockpiles of copper monitored by the LME have doubled since the start of last year. The exchange said earlier today copper stocks held in its warehouses had risen another 1,700 tonnes to total 194,875 tonnes

However it also reported that cancelled warrants, which represent warehouse stocks booked and due for delivery, have climbed to just over 17,000 tonnes, suggesting copper might soon start leaving LME warehouses

"With the large inflows of metal believed to be nearing an end, net falls in LME stocks could start to resume, which would support prices," said UBS Investment Bank analyst Robin Bhar

Simple supply and demand comes into play here. Higher supply = lower price.

Bloomberg has a bit more to flesh out the story:

Copper prices in New York had the biggest weekly decline in 10 years as slower U.S. economic growth and a building slump reduced demand for the metal used in homes, appliances and cars.

Global stockpiles are at the highest since June 2004. The U.S. economy grew at the slowest pace of 2006 in the third quarter, led by a decline in homebuilding. Builders are the biggest consumers of copper. Prices tumbled 12 percent this week, touching a nine-month low.

``I don't think anybody has predicted it would go this low,'' said Karen Poniachik, Chile's mining and energy minister and chairwoman of state-owned Codelco, the world's biggest copper producer.

According to Bloomberg, the slowdown in the US housing market is a prime reason for the drop:

Construction spending fell for a third month in November as homebuilding fell by 1.6 percent, the eighth-straight drop, the Commerce Department said this week. Fewer Americans signed contracts to buy previously owned homes in November, suggesting continuing weakness in the real estate, an industry group said yesterday.

``If overall housing sales stay slow, you could easily pare another 30 or 40 cents off of copper,'' Frank McGhee, head metals trader at Intergrated Brokerage Services Inc., said yesterday. ``Copper is a leading indicator. It's very sensitive to perceived economic conditions.''

Something to keep in mind is the futures markets have become the high tech market of the late 1990s. A ton of money flooded into the futures markets over the last 6 years. This is one of the reasons for the huge price run-ups over the same period. Increased demand = higher prices. Some of this selling may simply be people taking profits. In other words -- this could be speculators leaving the market.

However, the fundamentals indicates there may simply be weaker demand. Housing construction in the US is down. Overall stockpiles are up. This indicates copper production may be too high right now, anticipating a level of demand not warranted by the underlying economic fundamentals.

For market and economic commentary, go to the Bonddad Blog