Dec 18,2006
By Bonddad, bonddad@prodigy.net
Right now, the US economy appears to be moving into a soft landing. GDP growth is slowing but not turning negative. The unemployment rate is still technically good. The official BLS measure of inflation has declined the last several months -- although the alternate Cleveland Fed median CPI is still showing higher levels. Basically, Fed Chairman Bernanke has a lot to be pleased about. However, there are three economic wild cards that threaten the soft landing. These are oil, the dollar and housing.
Of these three wild cards, housing still causes the most concern.
Let’s review the general economic background. According to the Bureau of Economic Analysis, US GDP increased 5.6% in the first quarter, 2.6% in the second quarter and 2.2% in the third quarter. The BEA revised third quarter GDP up from 1.8% to 2.2%. However, the three quarter trend is clear: growth is slowing.
Housing is in a slump. The Federal Reserve made the following comment in its FOMC statement on December 12:
Economic growth has slowed over the course of the year, partly reflecting a substantial cooling of the housing market. Although recent indicators have been mixed, the economy seems likely to expand at a moderate pace on balance over coming quarters.
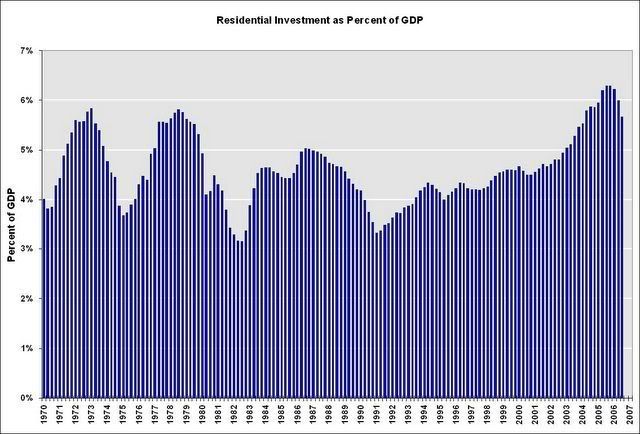
Housing will most likely continue to be a drag on GDP growth going forward. The chart below is from the blog Calculated Risk and shows the percentage of housing to GDP. The graph shows that housing has a long way to go before it returns to historically normal levels:
The employment picture is statistically solid:
Nonfarm payroll employment rose by 132,000 in November, and the unemployment rate was essentially unchanged at 4.5 percent, the Bureau of Labor Statistics of the U.S. Department of Labor reported today. Job gains continued in several service-providing industries, including professional and business services, food services, and health care. Employment declined in construction and manufacturing.
The US continues to lose manufacturing jobs. More importantly, construction sector employment topped out at the beginning of this year and is starting to turn downward.
Hourly wages have actually increased through November of this year. So far, hourly wages increased from $16.40 in January to $16.91 in November for an increase of 3.1%. Over the same period, the BLS’ inflation index increased from 198.3 to 201.5 for an increase of 1.61% making wage gains 1.49%. This is the first year of this expansion when wages have increased faster than inflation. So this is good news, but it will take a bit of time for 80% of the population to start making money beyond inflation. However that may prove difficult in a 2.2% GDP growth rate environment. I should add that using the Cleveland Federal Reserve’s median CPI calculation, inflation would still be rising faster than wages.
Finally there is inflation. The overall level of inflation isn’t as relevant as what the Fed thinks about the overall level of inflation. The Fed stated its position on inflation in the last FOMC statement:
Readings on core inflation have been elevated, and the high level of resource utilization has the potential to sustain inflation pressures. However, inflation pressures seem likely to moderate over time, reflecting reduced impetus from energy prices, contained inflation expectations, and the cumulative effects of monetary policy actions and other factors restraining aggregate demand.
Nonetheless, the Committee judges that some inflation risks remain. The extent and timing of any additional firming that may be needed to address these risks will depend on the evolution of the outlook for both inflation and economic growth, as implied by incoming information.
Short version – the Fed is still concerned about inflation. They still think a slowing economy will do the Fed’s job, but their statement gives them enough wiggle-room to raise rates if they need to. The Fed has been saying this for the last few months.
So using the above metrics we see the US is in a low-unemployment situation. Wages are either increasing slightly or are still stagnant depending on which inflation measure is used. Inflation is still too high according to the Fed, but they are willing to sit on the sidelines to let the economy slow inflation’s growth. But growth is slowing and the housing market is slumping. So the US economy is technically in OK to good shape, but certainly not something to write home about.
There are three wild cards going forward which place the "soft-landing" scenario in doubt.
The dollar
Below is a weekly chart for the dollar, going back a few years:
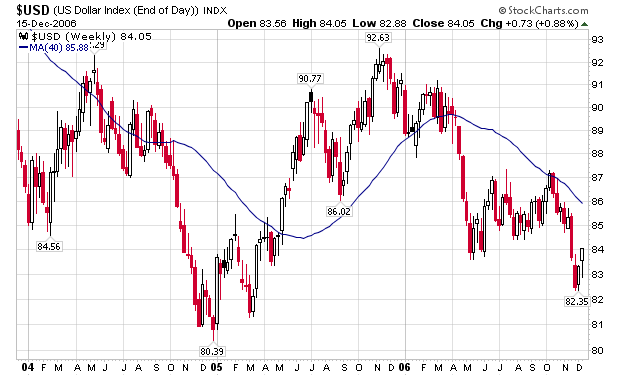
The dollar had been trading in an upward slanting range for most of the year. However, it broke through support in late November/early December. This indicates a downward change in the trend.
There are several reasons for this drop. The first is the interest rate differential between Europe and the US. The European Central Bank has increased rates while the US has maintained interest rates. This process has closed the interest rate gap between the US and the EU, taking away the carry-trade (borrowing in the US and lending in Europe) between the continents. In addition, European growth is picking up while the US is slowing down. This makes the euro a more attractive investment relative to the US.
In addition, the US trade deficit is again getting press time. Below is a chart of the overall US trade deficit from the St. Louis Federal Reserve.
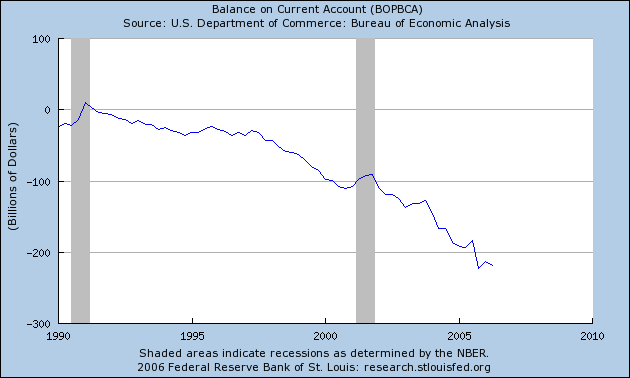
Although the deficit has narrowed over the last few months it is still on track to set another record this year. Paulsen’s visit to China may have opened the door going forward, but the US does not have any solid actions from China regarding the deficit as of yet. In addition, a large portion of the trade deficit’s recent increase is based on oil. As long as the US remains an oil dependent country we will have a trade deficit. So, while the deficit may narrow in the coming years, don’t expect any miracles.
The chart below from the St. Louis Reserve indicates that foreign holdings of debt have greatly increased the last four years.
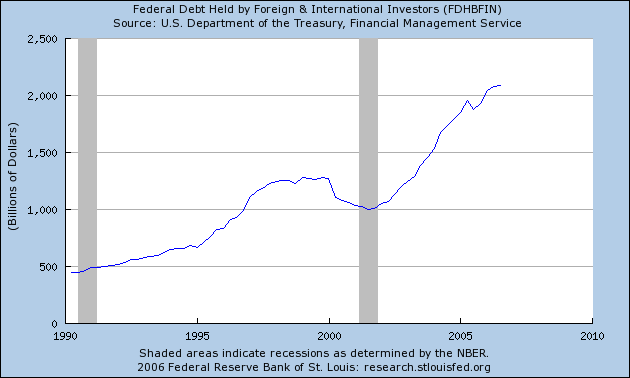
As more foreigner central banks take on more US dollar obligations, the possibility of a shift away from the dollar to other currencies (most notably the euro) increases. The quiet shift away from the dollar to the euro has already started. The South Korean, Japanese and Chinese governments have slowed their purchase of US debt, Russia has announced they will diversify their currency holdings into the euro, and OPEC has shifted 2% of their assets in the euro over the dollar.
The downtrend is in place. It will probably take a fundamental shift in world sentiment towards the dollar, the US trade deficit or the US economy to change the dollar’s direction.
What does a weakening dollar mean going forward? It creates two inter-related problems. First, a cheaper currency means imported goods increase in price. This increases the possibility of importing inflation. This leads to the second problem – hemming-in interest rate policy. Several economists have predicted the Fed will lower interest rates sometime in 2007. However if import prices increase to a high enough level the Fed won’t be able to lower interest rates to stimulate the economy if it slows down.
Oil
Below is a weekly chart for oil, going back a few years.
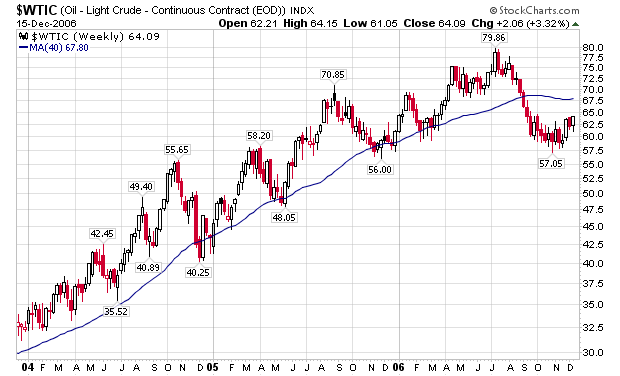
Oil has come down from it’s yearly high in about September. One of the quiet market forces leading to this decline was Goldman Sachs re-weighting a major commodity index. They changed gas’ weighting from 7.3% to 2.5%. Whenever a market index changes a component’s weighting mutual funds, index funds and other investment managers who track the index must also re-weight their respective portfolios. This resulted in a net selling of oil futures.
However, there are other fundamental reasons for oil’s drop which primarily center around the US’ slowing economic growth. The US is the world’s largest oil consumer. When the US economy slows, overall oil demand slows (This may have been a reason for Goldman lowering oil’s importance in its index). A drop in US demand will have a negative impact on oil’s price. However, India’s and China’s growing economies provide a floor for oil prices, which the market currently pegs right around $60/bbl.
In addition, OPEC has announced two production cuts. The first went into effect about a month ago and the second is scheduled to go into effect in February. This provides additional support for oil’s price. OPEC’s members have a habit of breaking production cuts because there is no formal enforcement mechanism within the OPEC cartel. So we will have to wait and see how effective this cut in production actually is.
Finally with regard to oil, the world economy is only one geopolitical event away from an oil price spike. With the US Iraq policy in a state of flux this risk increases.
Housing
Housing has been slowing for the last six months or so. There are three inter-related problems with housing that do not bode well for the future. A slowing rate of purchases is the first problem. According to the latest Census data on new home sales, the year-over-year (YOY) sales rate has declined 25% from an annual pace of 1.3 million homes to 1 million homes. According to the National Association of Realtors, the YOY sales rate of existing homes has decreased 11.5%. The second problem is an increasing inventory level. The total inventory of new homes available for sales has increased 13.8% from October October 2005 levels, from 490,000 units to 558,000 units in October 2006. The slowing rate of purchases has increased the number of months of available inventory from 4.5 months to 7 months from October 2005 to October 2006. Existing home inventory has increased from 2.868 million units in October 2005 to 3.854 million units in October 2006 – an increase of 34%. Meanwhile, the slowing rate of existing home purchases has increased the months available for sale to 7.4. Finally, there is the issue of total household debt outstanding, which has greatly accelerated during this expansion. The chart below shows the rapid escalation in household debt for the duration of this expansion.
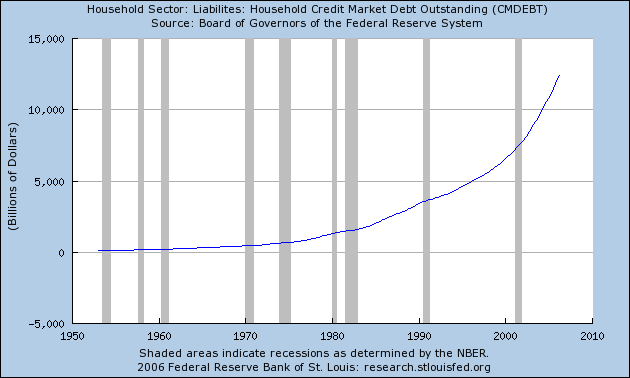
No soft-landing housing person has been able to answer the following question: "How much more debt can the US consumer put on his respective balance sheet?" The US consumer is already massively in debt and most people already have houses, leading to the question of "who will actually buy this inventory?"
To sum up we have the following. The current economic environment plays out the soft landing scenario. However, there are three economic wildcards that will take time to play out: the dollar’s overall value, oil and the domestic housing market. Housing is still the number one concern. There's a ton of inventory on the market and buyers are already massively in debt.
A downturn in either one of these three could tip the US into a recession. So while the soft-landing camp has plenty to cheer about right now, raising a toast is very premature.
For an update on the market and current economic events, go to the bonddad blog
No comments:
Post a Comment