By Bonddad
bonddad@prodigy.net
Below is a compilation of several posts on my blog. I've put these together in one mega-market post. I hope this helps to explain and assuage some fears out there.
The markets on Friday
Traders don't want to hold anything over the weekend in this market. Take a look at the last two bars of both the SPYs and QQQQs -- there's a ton of volume and a strong downtrend. In addition, the markets closed near their lowest point of the day. This indicates there is some pretty strong bearishness in the market right now.
SPY:
QQQQ:
A review of the week and daily charts
U.S. stocks dropped to a three-month low, completing their worst week since January 2003, after a decline in consumer confidence magnified the risk profit growth will be wiped out by a recession.
Let's go to the charts in the following order: SPY, QQQQ, IWN
These charts highlight four points.
1.) Tuesday was the big day of losses with a sudden drop at the open and continued weakness throughout the day.
2.) Friday we drifted downward and closed on a low-point.
3.) The overall trend for the week is down.
4.) You can literally draw a line from the upper left to the lower right of each chart and have the line represent the week's trend.
Let's go the the daily charts, courtesy of stockcharts.
Here's the SPY:
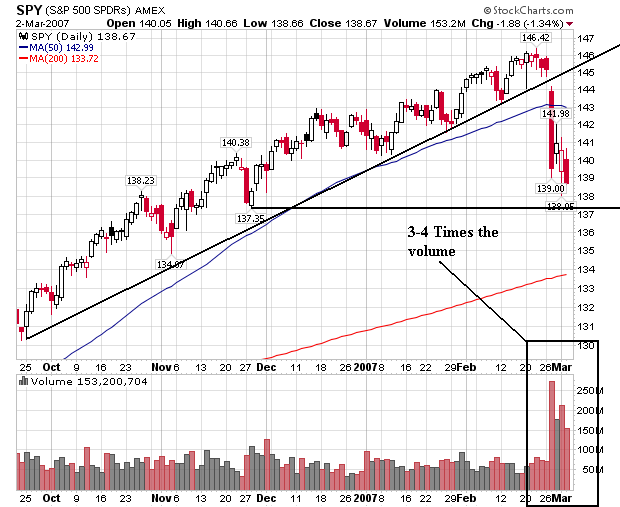
1.) There is a big jump in volume above the preceding 3-4 months. This indicates sellers were looking to get out.
2.) The index closed below the 50-day SMA.
3.) The index clearly broke the 6-month uptrend and broke through previous support levels.
Here's a chart for the QQQQs
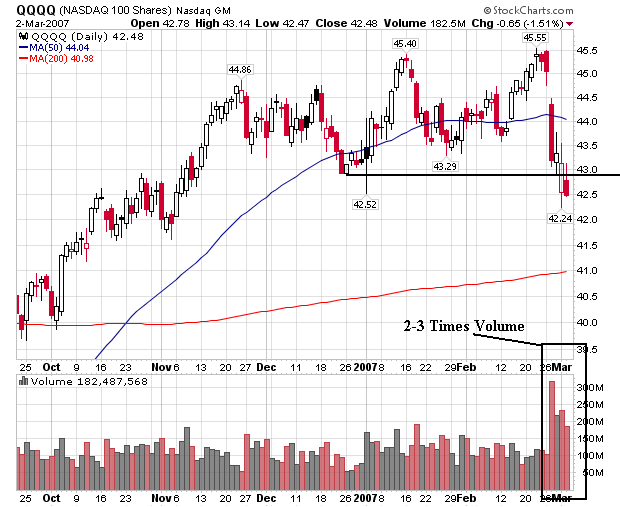
1.) There are 4 days of heavy selling on between 2-3 times the normal volume for the preceding 3-4 months.
2.) The index closed below the 50 day SMA.
3.) The QQQQs have traded in a range between (roughly) 42.50 and 45.50 for the last three months. We closed below that range on Friday.
Here's a chart for the IWNs
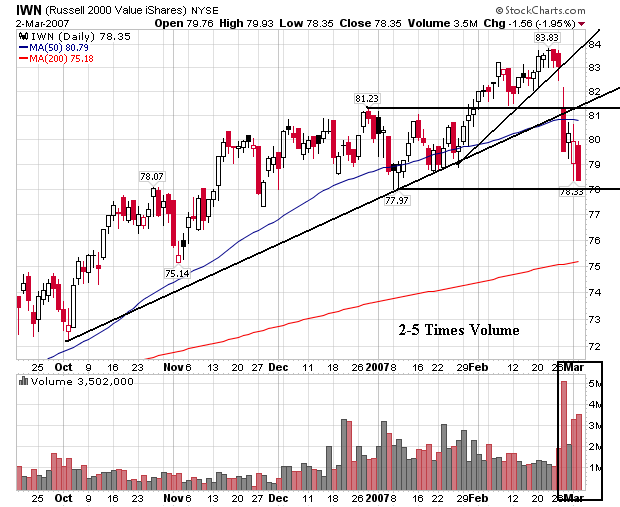
1.) We had the heaviest selling of the indexes here -- up to 5 times the norm for the last 3-4 months.
2.) The index closed below the 50-day SMA.
3.) The index broke through two uptrends -- one that started at the beginning of October and one that started at the end of January.
All of these indexes had long red bars with large volume. This means sellers are in control and looking to book profits.
Fundamental Reasons for the Sell-off
1.) The BEA lowered GDP estimates from 3.5% to 2.2%. First, this is a large revision. People will make entirely different economic assumptions about an economy growing at a 3.5% growth rate than an economy at a 2.2% growth rate. Secondly, this is the third quarter of sub-par growth, indicating we are definitely in the cooling off stages.
2.) New Home sales dropped 16%. There is a high margin of error with this number, so it can be revised upwards. However, the initial reading put the "the housing market has bottomed" people out to pasture.
3.) Durable goods orders dropped 7.1%. Even without transportation, this number dropped 3.1%.
4.) Weekly unemployment claims are ticking up. The 4-week moving average increased from 327,000 on February 10 to 335,000 in the latest report. However, bear in mind this is a noisy report and is subject to revisions etc...
5.)While personal income increased (a net positive) the core PCE inflation level increased .2%. This takes away fuel to the "Fed will lower interest rates soon" argument.
6.) Construction spending dropped .8% in January. This adds further fuel to the slowing housing market story.
7.) While existing home sales increase last month they did so because of a 5% December to January price decrease, a 3.1% year-over-year price decrease, a 3% increase in the month-to-month inventory and a 23% increase in year-over-year inventory. In other words, the high inventory figures are starting to hit prices and we still have a ton of homes to sell.
8.) Countrywide Financial announced 20% of the subprime loans they service are late with payments. This indicates there is probably more trouble ahead for an already troubled part of the economy.
The Bullish Argument Going Forward
This is the Barron's cover story this week (subscription required). The article makes some good points.
Before Tuesday, every major stock market in the world -- and nearly all the smaller markets -- were near 52-week highs. Most markets also were near record levels, with the notable exceptions of the Nasdaq Composite and Standard & Poor's 500, a reflection of the absurd valuations they had reached in the tech boom of 2000.
.....
A bullish Wien thinks the S&P 500 could hit 1,600 by year end, a 15% gain. He says U.S. stocks look attractive with the S&P valued at 15 times projected 2007 operating earnings. The Dow Jones Industrial Average trades at 14.4 times estimated "07 profits. Both the Dow and the S&P 500 are in negative territory for the year, with the industrials off 2.8% and the S&P 500 down 2.2%. The so-called earnings yield on both the S&P 500 and the Dow is close to 7%, which compares favorably with the 4.5% yield on 10-year Treasuries. The earnings yield is the inverse of the market's price-earnings ratio.
Companies continue to lift dividends and repurchase record amounts of stock in order to reward shareholders -- and stay out of the sights of private-equity shops on the prowl for new leveraged buyouts.
.....
HISTORY SUGGESTS THAT STOCKS MAY DO WELL in the next two months. There have been 38 days since 1979 when the S&P 500 has suffered a single-session loss of 3% or more. The average gain in the ensuing 60 days has been 6.9%, with the index rising in 31 of the 38 cases, according to Citigroup research.
There are some very solid technical arguments here. First, the market isn't cheap but certainly not expensive by historical standards. While corporate profit growth is expected to slow, it is still pretty healthy. And traders are conditioned to buy on dips, meaning there could be some buying nibbles at attractive technical levels over the next few weeks.
The article does state overall slowing economic growth is the primary reason the markets may not advance. This is a strong counter-argument. As I wrote above, there was a ton of bad economic news last week that provided the fundamental reason for the continued market weakness throughout the week. I think the market is starting to price in the slower growth scenario going forward.
I still think housing is the main wild card going forward. There is still a ton of inventory to clear and last week's numbers indicate it will take lower priced to do it. Housing starts are slowing, which means we will probably have a large amount of construction lay-offs in the coming months. However, the business construction sector may absorb some of these displaced workers if non-residential construction levels continue at current levels.
I wouldn't be surprised to see the market far more sensitive to bad economic news over the next few weeks. Up until last week, the market was able to shrug off some bad news, basically arguing that problems were contained within specific market sectors -- especially housing problems. However, I think we'll start to see some of housing issues -- especially in the mortgage area -- start to spread-out to other market sectors like financials (mortgage related issues) and consumer durables (furniture/appliances).
Food for thought
No comments:
Post a Comment