By Bonddad
bonddad@prodigy.net
I've been bearish on the economy for the last two years. Every 4-6 months, I revisit my bearishness to see if it is still warranted. It is. Underlying the great and fabulous growth of the "greatest story never told (according the Larry Kudlow) is a mountain of debt at the federal and personal level, stagnating wages a negative national savings rate and a trade deficit that while showing some signs of improvement is still at dangerous levels.
The standard refrain regarding this points is "nothing bad has happened yet. Therefore we shouldn't worry about these things." While it is true that nothing bad has happened, we have to ask ourselves a fundamental question: "Is this the way we want to build and manage the largest economy in the world?"
Debt
When used properly, debt can increase leverage and allow an investor to increase his return. When used poorly, debt is a crutch that hides the basic problems of an economy. Unfortunately, the US is using debt poorly at the federal and household level.
At the federal level we have once again seen an explosion of debt issuance. While the White House is claiming the budget deficit is decreasing, the amount of debt issued for the last 6 years indicates otherwise. According to the Treasury Department, the total debt outstanding on September 30 2001 was $5,807,463,412,200.06. That number was $8,713,570,341,089.42 as of February 12, or an increase of nearly $3 trillion dollars. The amount of interest on that debt is increasing:
2006 $405,872,109,315.83
2005 $352,350,252,507.90
2004 $321,566,323,971.29
2003 $318,148,529,151.51
2002 $332,536,958,599.42
2001 $359,507,635,242.41
Here is a chart from the St. Louis Federal Reserve that shows the year-over-year increase in interest payments.
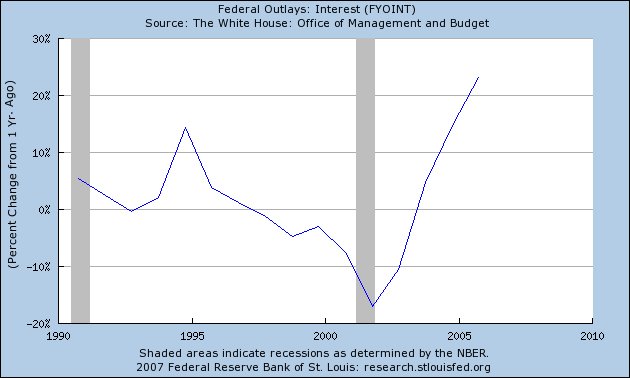
As we enter a period when higher interest rates are more likely simply because rates have been at generational lows for the last 4 years, these number will obviously go higher.
At the household level we have also seen an explosion of debt use, especially in the last 5 years. Here's a chart of total household debt outstanding from the St. Louis Federal Reserve:
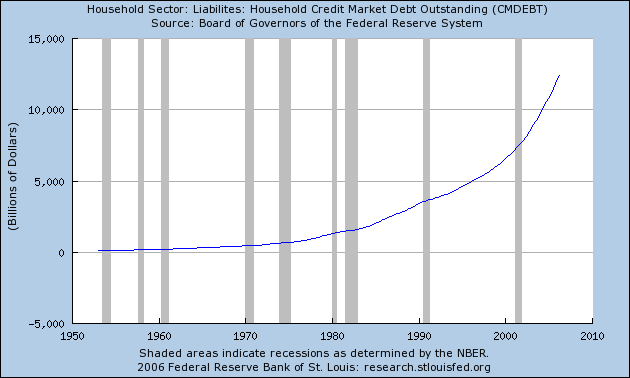
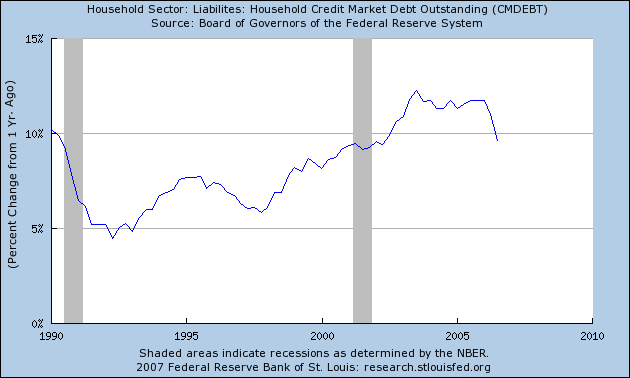
Notice the higher arc of the last few years that occurred during this expansion. The next chart shows how the year over year change in household debt is twice as high during this expansion as the previous expansion.
The following chart shows how total debt service payments are at record highs of disposable income.
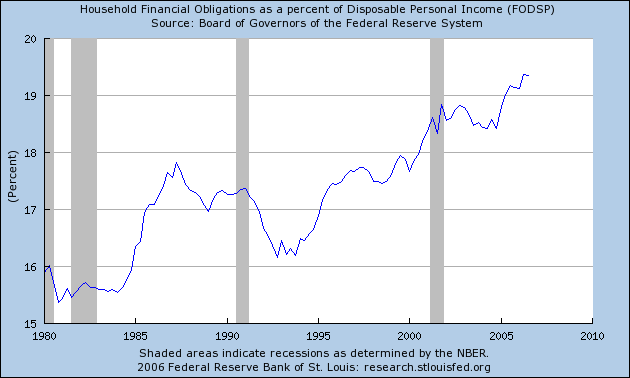
All of this has occurred at a time when wages for most Americans have been stagnant, despite some large productivity increases we have seen (thanks to Tula Connell for the graph).
So, the great increase in the standard of living has not come from higher wages, but instead by borrowing today in hopes of repayment tomorrow.
Stagnant Wages
In case you were wondering, the graph above indicates that wages for the average American have been stagnant for the last 6 years as well. Here's another graph from Kash at the Streetlight economic blog
Here's how he sums up the chart:
In recent months the drop in gas prices has pushed real earnings noticeably higher, but those earnings are still only around 2% above where they were seven years ago.
So after accounting for consumer price inflation, the average production worker takes home about $10 more per week than he or she did in the year 2000. It's no wonder that lots of people feel that economic growth is passing them by...
Savings (or lack therefor).
So, what happens when a person with all of this debt loses his job? Well, there isn't much to fall back on. Here is a chart from the St. Louis Fed that shows the national savings rate:
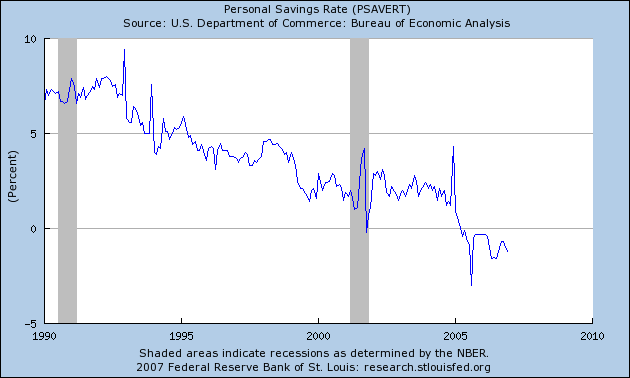
There has been a fair amount of ink devoted to proving the official savings rate is not a good measure. Unfortunately for this argument, three other studies have confirmed the savings crisis is very real. The short version is simple: one financial catastrophe and the average American family is knee-deep in trouble.
The trade deficit
The US is consuming more than it produces. We buy far more goods than we sell, as evidenced by the mammoth US trade deficit:
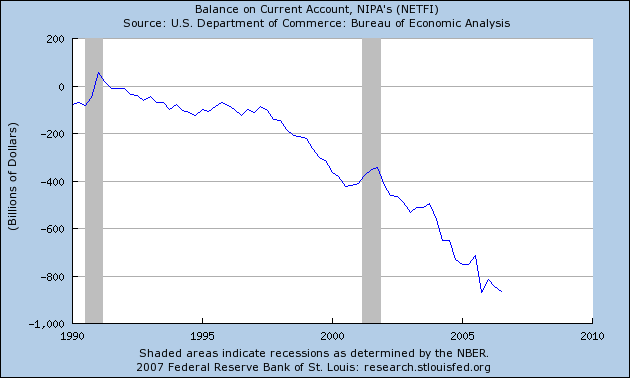
The trade deficit is a primary reason why foreign investors have almost doubled their investments in US debt securities over the last 5 years.
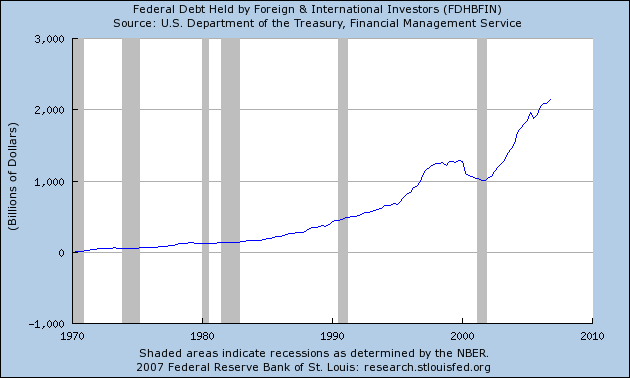
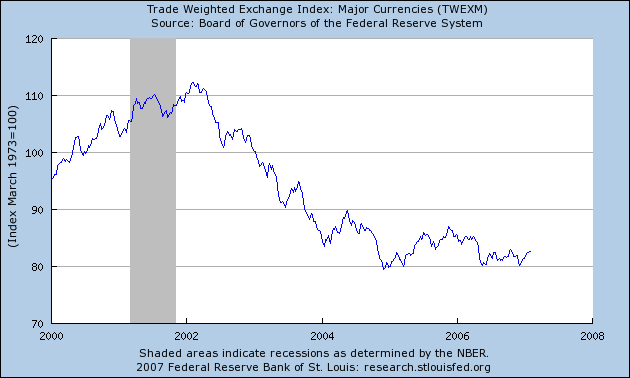
Like the savings situation, some have tried to argue the deficit isn't a problem because either nothing bad has happened yet or this calculation is wrong or a combination of both. The problem with this argument is the forex market clearly disagrees, as they have sent the dollar on a four-year long downward trajectory.
Conclusion
So where does this leave the economy? Massively in debt and vulnerable to random events. Now we can bury our heads in the sand or try to claim that "something is fundamentally different with this current situation" that makes standard economic analysis fruitless, or we can start to change the way we conduct business.
But then again, nothing bad has happened yet, so why worry?
No comments:
Post a Comment