By Bonddad
bonddad@prodigy.net
There's a new centrist group out called the Third Way Project. While I am all for a centrist approach on most points -- largely because I am a centrist -- their analysis has more in common with a Larry Kudlow "analysis" then a serious policy paper. Below I will explain why.
Debt
The Third Way Project (TWP) focuses on the increase in mortgage debt and argues, "much of this new debnt is mortgage debt, and most families would consider buying a house an investment, not a negative event."
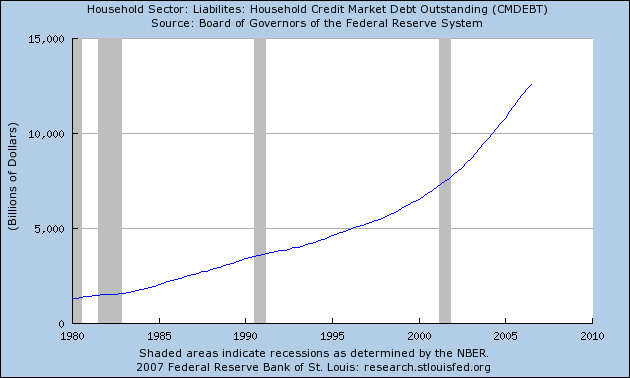
However, this is an overly simplistic explanation of the overall problem. First, the total amount of household debt in the US economy is at incredibly high levels. According to the Federal Reserve’s Flow of Funds statement, total household debt outstanding is $12.5 trillion dollars. This is over 90% of the total US GDP and over 120% of disposable income.
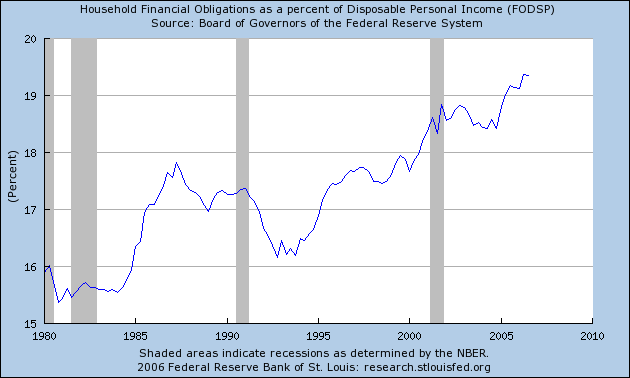
Debt payments as a percentage of total income are at record levels.
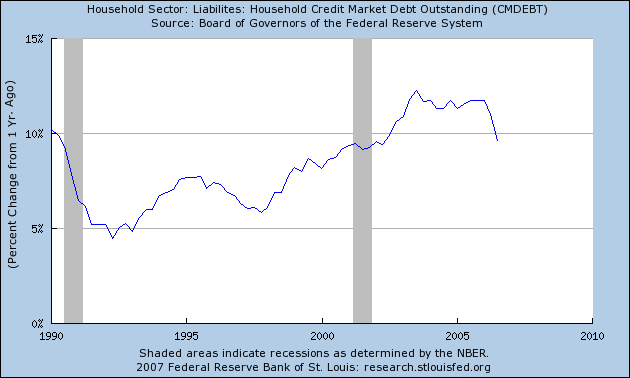
According to the St. Louis Federal Reserve’s FRED economic data system, the year-over-year increase in total debt acquisition by US households is over 10% for this expansion – nearly twice the level as the expansion in the 1990s.
Also according to the FRED system, total homeowner’s equity at the national level is at record lows.
In short – the US is drowning in debt. There is no other way to spin these numbers.
The TWP uses the classic household net worth argument to justify these levels of debt. Household net worth at the national level is also from the Fed’s Flow of Funds statement, and is essentially a tally of all household assets and debts at the national level. While household net worth has increased during this expansion, the TWP fails to take the extreme stratification of wealth into account. As the FDIC noted
While there is no definitive standard for how much a person needs for retirement, many baby boomers appear to have a net worth insufficient to meet basic retirement needs, according to some guidelines.9 In 2004, the median net worth for families headed by baby boomers between the ages of 45 and 54 was $144,700.10 However, these data are somewhat difficult to interpret, as wealth holdings in the United States are skewed toward the top 10 percent of families (see Chart 3, next page). The median family net worth was $1,700 for the lowest 25 percent of U.S. households and $43,600 for those in the 25th to 49th percentile. In contrast, those in the 75th to 89th percentile had median family net worth of $506,800, while the figure for those in the top 10 percent was $1.4 million. These data do not apply only to baby boomers, however. Chart 3 suggests that although many families have a fairly substantial amount of assets, a large number have few resources with which to supplement retirement income.
In other words, incomes at the top 10% of the income ladder are largely responsible for the great totals.
Savings
See the above statement from the FDIC regarding wealth holding. In addition, A Boston College Study concluded
A new retirement study provides further evidence that a growing number of Americans are at risk of a diminished standard of living once they stop working.
The Center for Retirement Research's new retirement-risk index, released Tuesday, shows 43% of working households were in danger in 2004 of having too little income to fund their retirement.
But the study probably understates the proportion of retirees at risk. Its projections assume that people retire at age 65, cash in on their home equity through a "reverse mortgage" and exchange their assets for a stream of income by buying an immediate annuity.
Yet many people retire before 65, according to the center, and don't necessarily buy immediate annuities or take out reverse mortgages. Nor does the research take in account the "wild card" of health care costs — and how these expenses will affect retirees' standards of living, says Alicia Munnell, director of the center at Boston College.
The percentage of "at risk" households has surged in the past two decades, from 31% in 1983, according to the center's analysis, which was funded by Nationwide Mutual Insurance. Two factors that have raised the risks are the growing uncertainty of Social Security payouts and the increasing burden on employees to save for their own retirements.
The index, which uses data from the Federal Reserve, is part of a stream of recent sobering conclusions about workers' abilities to finance their golden years. The studies come as the first of 79 million baby boomers — the generation born from 1946 to 1964 — are turning 60 this year.
And finally, there is this study from the Employee Benefit Research Group. It found that 63% of people have less than $100,000 saved for retirement. The paltry savings levels reported in the Flow of Funds report backs-up this fact. $100,000 is clearly insufficient to provide for income for a 20-year period, even with social security.
TWP also wants to include a variety of items in savings that frankly make no sense. First, they want to include home equity totals. As noted above, home equity is currently at a 50 year low. Secondly, households must go into debt to tap equity. As noted above, household dent levels are already at record levels. Investing in college tuition and corporate research and development is not savings. These are investments. In addition – the TWP does not mention that college debt payments are also a primary reason why college graduates are having difficulty moving up the socio-economic ladder. As for the inclusion of "sweat equity" – investment in a business, this figure is already included in national income figures. The attempt at including these figures is a classic trick of the right wing noise machine – whenever you don’t like an economic number, change it’s definition to make it look better.
Income
Let’s start with a few facts from the Bureau of Labor Statistics. The TWC uses 1974 as a starting point on wages. In January 1974, the average housely wage of production workers was $4.26. This figure was $17.09 in January of 2007, for an increase of 301%. Over the same time period, the inflation level increased from 46.6 to 202.416, for an increase of 334%. That means that wages have actually decreased since 1974 in inflation adjusted terms.
In addition, the Gini Index (a measure of income inequality) increased from .39 to .46 from 1974 to 2001. This means that income inequality has increased over the time frame the TWP sites.
TWP’s statements also provide their own rebuttal.
TWP concedes:
"It is true that much (but not all) of household income gain can be attributed to wives working more,, but neopopulists see the increased female workload in an entirely negative context and as a burden on women and families. We suspect many working-women want to work.
Translation: family incomes haven’t increased because wages have increased. Instead family wages have increased because more people in the family are working. I am not making this statement to disparage anybody who wants to work. However, as the number of people entering the workforce has increased, average hourly earnings (as stated above) have decreased.
In addition, TWP also notes – in their own study – that incomes in the 90th percentile have increased nearly twice as fast as incomes in the 50th percentile. In short – the rich are increasing their wages at twice the level as those in the middle.
And finally, there are these points from Lou Dobbs:
The middle class is also working more hours than ever before: Thirty years ago Americans worked an average of 43 weeks, but now U.S. workers are putting in an average of 47 weeks per year, according to the Bureau of Labor Statistics. That's in stark contrast to the rest of the industrialized world, where the number of hours worked in all other countries except for Canada has decreased over the past 30 years, the Organization for Economic Cooperation and Development reported.
About one-third of the families in this country bring in less than $35,000 of income each year, according to the Census Bureau, a figure that's nowhere close to ensuring the quality of life and standard of living to which many Americans have grown accustomed. I fear the American Dream may finally become the American Pipe Dream.
These families at the bottom of the wage scale are really struggling. According to the Federal Reserve's most recent comprehensive Survey of Consumer Finances (released every three years), average family income from 2001 to 2004 fell 2.3 percent, and the median net worth of the bottom 40 percent of families declined as well. And real median wages declined by more than 6 percent during the same period.
While these guys do get an A for effort for trying to find the middle ground, they instead are siding with Republican spin. Better luck next time.
No comments:
Post a Comment