Showing posts with label economics. Show all posts

Friday, March 2, 2007

The Big Meltdown: PAUL KRUGMAN - Financial Crisis

THE COMPLETE ARTICLE
THE NEW YORK TIMES
OP-ED COLUMNIST

The Big Meltdown

By PAUL KRUGMAN
Published: March 2, 2007

If we’re going to have a financial crisis, here’s how it will play out.

The great market meltdown of 2007 began exactly a year ago, with a 9 percent fall in the Shanghai market, followed by a 416-point slide in the Dow. But as in the previous global financial crisis, which began with the devaluation of Thailand’s currency in the summer of 1997, it took many months before people realized how far the damage would spread.

At the start, all sorts of implausible explanations were offered for the drop in U.S. stock prices. It was, some said, the fault of Alan Greenspan, the former chairman of the Federal Reserve, as if his statement of the obvious — that the housing slump could possibly cause a recession — had been news to anyone. One Republican congressman blamed Representative John Murtha, claiming that his efforts to stop the “surge” in Iraq had somehow unnerved the markets.

Even blaming events in Shanghai for what happened in New York was foolish on its face, except to the extent that the slump in China — whose stock markets had a combined valuation of only about 5 percent of the U.S. markets’ valuation — served as a wake-up call for investors.

The truth is that efforts to pin the stock decline on any particular piece of news are a waste of time.

Wise analysts remember the classic study that Robert Shiller of Yale carried out during the market crash of Oct. 19, 1987. His conclusion?

---MORE--

Friday, February 23, 2007

Third Way Project: A Pack of Economic Lies

Feb 23, 2007

By Bonddad
bonddad@prodigy.net

There's a new centrist group out called the Third Way Project. While I am all for a centrist approach on most points -- largely because I am a centrist -- their analysis has more in common with a Larry Kudlow "analysis" then a serious policy paper. Below I will explain why.

Debt

The Third Way Project (TWP) focuses on the increase in mortgage debt and argues, "much of this new debnt is mortgage debt, and most families would consider buying a house an investment, not a negative event."

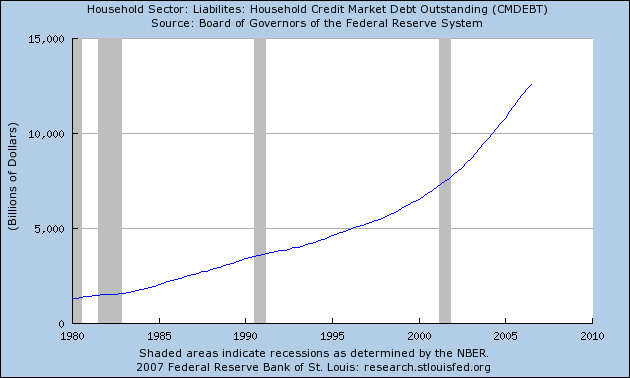
However, this is an overly simplistic explanation of the overall problem. First, the total amount of household debt in the US economy is at incredibly high levels. According to the Federal Reserve’s Flow of Funds statement, total household debt outstanding is $12.5 trillion dollars. This is over 90% of the total US GDP and over 120% of disposable income.

Photobucket - Video and Image Hosting

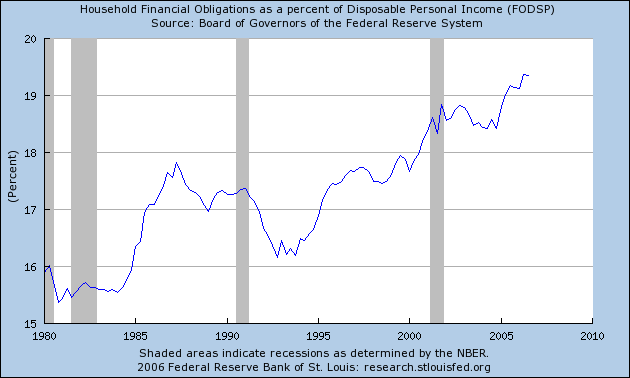
Debt payments as a percentage of total income are at record levels.

Photobucket - Video and Image Hosting

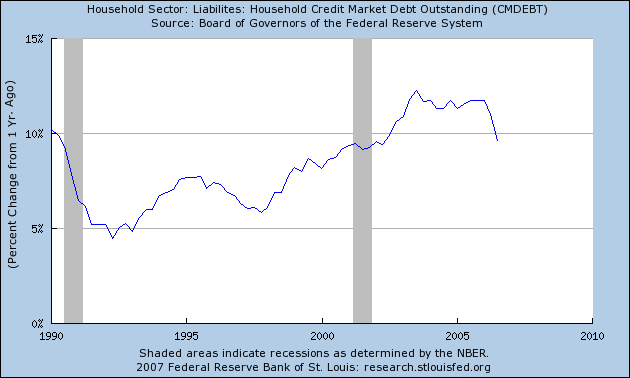
According to the St. Louis Federal Reserve’s FRED economic data system, the year-over-year increase in total debt acquisition by US households is over 10% for this expansion – nearly twice the level as the expansion in the 1990s.

Photobucket - Video and Image Hosting

Also according to the FRED system, total homeowner’s equity at the national level is at record lows.

In short – the US is drowning in debt. There is no other way to spin these numbers.

The TWP uses the classic household net worth argument to justify these levels of debt. Household net worth at the national level is also from the Fed’s Flow of Funds statement, and is essentially a tally of all household assets and debts at the national level. While household net worth has increased during this expansion, the TWP fails to take the extreme stratification of wealth into account. As the FDIC noted

While there is no definitive standard for how much a person needs for retirement, many baby boomers appear to have a net worth insufficient to meet basic retirement needs, according to some guidelines.9 In 2004, the median net worth for families headed by baby boomers between the ages of 45 and 54 was $144,700.10 However, these data are somewhat difficult to interpret, as wealth holdings in the United States are skewed toward the top 10 percent of families (see Chart 3, next page). The median family net worth was $1,700 for the lowest 25 percent of U.S. households and $43,600 for those in the 25th to 49th percentile. In contrast, those in the 75th to 89th percentile had median family net worth of $506,800, while the figure for those in the top 10 percent was $1.4 million. These data do not apply only to baby boomers, however. Chart 3 suggests that although many families have a fairly substantial amount of assets, a large number have few resources with which to supplement retirement income.

In other words, incomes at the top 10% of the income ladder are largely responsible for the great totals.

Savings

See the above statement from the FDIC regarding wealth holding. In addition, A Boston College Study concluded

A new retirement study provides further evidence that a growing number of Americans are at risk of a diminished standard of living once they stop working.

The Center for Retirement Research's new retirement-risk index, released Tuesday, shows 43% of working households were in danger in 2004 of having too little income to fund their retirement.

But the study probably understates the proportion of retirees at risk. Its projections assume that people retire at age 65, cash in on their home equity through a "reverse mortgage" and exchange their assets for a stream of income by buying an immediate annuity.

Yet many people retire before 65, according to the center, and don't necessarily buy immediate annuities or take out reverse mortgages. Nor does the research take in account the "wild card" of health care costs — and how these expenses will affect retirees' standards of living, says Alicia Munnell, director of the center at Boston College.

The percentage of "at risk" households has surged in the past two decades, from 31% in 1983, according to the center's analysis, which was funded by Nationwide Mutual Insurance. Two factors that have raised the risks are the growing uncertainty of Social Security payouts and the increasing burden on employees to save for their own retirements.

The index, which uses data from the Federal Reserve, is part of a stream of recent sobering conclusions about workers' abilities to finance their golden years. The studies come as the first of 79 million baby boomers — the generation born from 1946 to 1964 — are turning 60 this year.

And finally, there is this study from the Employee Benefit Research Group. It found that 63% of people have less than $100,000 saved for retirement. The paltry savings levels reported in the Flow of Funds report backs-up this fact. $100,000 is clearly insufficient to provide for income for a 20-year period, even with social security.

TWP also wants to include a variety of items in savings that frankly make no sense. First, they want to include home equity totals. As noted above, home equity is currently at a 50 year low. Secondly, households must go into debt to tap equity. As noted above, household dent levels are already at record levels. Investing in college tuition and corporate research and development is not savings. These are investments. In addition – the TWP does not mention that college debt payments are also a primary reason why college graduates are having difficulty moving up the socio-economic ladder. As for the inclusion of "sweat equity" – investment in a business, this figure is already included in national income figures. The attempt at including these figures is a classic trick of the right wing noise machine – whenever you don’t like an economic number, change it’s definition to make it look better.

Income

Let’s start with a few facts from the Bureau of Labor Statistics. The TWC uses 1974 as a starting point on wages. In January 1974, the average housely wage of production workers was $4.26. This figure was $17.09 in January of 2007, for an increase of 301%. Over the same time period, the inflation level increased from 46.6 to 202.416, for an increase of 334%. That means that wages have actually decreased since 1974 in inflation adjusted terms.

In addition, the Gini Index (a measure of income inequality) increased from .39 to .46 from 1974 to 2001. This means that income inequality has increased over the time frame the TWP sites.

TWP’s statements also provide their own rebuttal.

TWP concedes:

"It is true that much (but not all) of household income gain can be attributed to wives working more,, but neopopulists see the increased female workload in an entirely negative context and as a burden on women and families. We suspect many working-women want to work.

Translation: family incomes haven’t increased because wages have increased. Instead family wages have increased because more people in the family are working. I am not making this statement to disparage anybody who wants to work. However, as the number of people entering the workforce has increased, average hourly earnings (as stated above) have decreased.

In addition, TWP also notes – in their own study – that incomes in the 90th percentile have increased nearly twice as fast as incomes in the 50th percentile. In short – the rich are increasing their wages at twice the level as those in the middle.

And finally, there are these points from Lou Dobbs:

The middle class is also working more hours than ever before: Thirty years ago Americans worked an average of 43 weeks, but now U.S. workers are putting in an average of 47 weeks per year, according to the Bureau of Labor Statistics. That's in stark contrast to the rest of the industrialized world, where the number of hours worked in all other countries except for Canada has decreased over the past 30 years, the Organization for Economic Cooperation and Development reported.

About one-third of the families in this country bring in less than $35,000 of income each year, according to the Census Bureau, a figure that's nowhere close to ensuring the quality of life and standard of living to which many Americans have grown accustomed. I fear the American Dream may finally become the American Pipe Dream.

These families at the bottom of the wage scale are really struggling. According to the Federal Reserve's most recent comprehensive Survey of Consumer Finances (released every three years), average family income from 2001 to 2004 fell 2.3 percent, and the median net worth of the bottom 40 percent of families declined as well. And real median wages declined by more than 6 percent during the same period.

While these guys do get an A for effort for trying to find the middle ground, they instead are siding with Republican spin. Better luck next time.

Wednesday, February 21, 2007

The New Road to Serfdom: An illustrated guide to the coming real estate collapse

By Michael Hudson

Michael Hudson is Distinguished Professor of Economics at the University of Missouri, Kansas City and the author of many books, including "Super Imperialism: The Origin and Fundamentals of U.S. World Dominance."

Nigel Holmes was the graphics director of Time magazine for sixteen years and is the author of Wordless Diagrams.


Even men who were engaged in organizing debt-serf cultivation and debt-serf industrialism in the American cotton districts, in the old rubber plantations, and in the factories of India, China, and South Italy, appeared as generous supporters of and subscribers to the sacred cause of individual liberty.

- H. G. Wells, The Shape of Things to Come

--MORE--

The New Road to Serfdom: An illustrated guide to the coming real estate collapse

By Michael Hudson

Michael Hudson is Distinguished Professor of Economics at the University of Missouri, Kansas City and the author of many books, including "Super Imperialism: The Origin and Fundamentals of U.S. World Dominance."

Nigel Holmes was the graphics director of Time magazine for sixteen years and is the author of Wordless Diagrams.


Even men who were engaged in organizing debt-serf cultivation and debt-serf industrialism in the American cotton districts, in the old rubber plantations, and in the factories of India, China, and South Italy, appeared as generous supporters of and subscribers to the sacred cause of individual liberty.

- H. G. Wells, The Shape of Things to Come

--MORE--

Friday, January 19, 2007

Minimum wage increase could die in compromise with ethics bill

January 19, 2007

Senate Breaks Impasse on Ethics Bill

The Senate passed a broad overhaul of ethics, lobbying and earmark regulations yesterday after Democratic and Republican leaders broke a two-day logjam over GOP amendments.

The Senate passed the bill by a more-than-comfortable margin of 96-2, after Majority Leader Harry Reid, D-Nev., agreed to give Judd Gregg, R-N.H., a vote on a line-item rescissions amendment next week. Reid also agreed to accept an amendment by Tom Coburn, R-Okla., that would prohibit lawmakers from pushing earmarks that would benefit them, their families, their aides or their aides’ families.

“We will restore the confidence of our citizenry in the United States government,” Reid said.

The bill (S 1) would ban senators and their staff from accepting meals, gifts and trips from lobbyists; prohibit senators from negotiating for private-sector jobs while still in office; create a point of order against bills that do not identify the sponsors of earmarks; establish a database of lobbyists’ contacts and activities; and force lobbyists to certify that they have complied with the gift ban.

“This is a classic example of bipartisanship here in the Senate at its very best,” said Minority Leader Mitch McConnell, R-Ky., who co-wrote the bill with Reid.

But Coburn, one of two senators to vote against the final bill, predicted that some of the most stringent provisions — including his own amendment — will never be enacted. “They’re going to be discarded once we get to conference,” he said.

The House has not passed any changes to lobbying law, so a conference committee is unlikely to convene any time soon. The House changed its rules governing earmarks, gifts and other ethics standards by adopting a resolution that applied only to that chamber (H Res 6).

Before the Senate bill’s passage, an amendment by Robert F. Bennett, R-Utah, was adopted deleting a provision that would have subjected so-called “astroturf” lobbying groups to disclosure requirements.

The lobbying provisions were opposed by interest groups as diverse as the conservative Traditional Values Coalition and the liberal American Civil Liberties Union, and Bennett’s amendment was adopted, 55-43.

The Senate rejected, 27-71, an amendment that would have created an independent Office of Public Integrity with the power to investigate ethics complaints and make recommendations to the Senate Select Ethics Committee.

Amendments Adopted

Despite the coordination between party leaders, it took two days of negotiation to break a stalemate on Gregg’s amendment and a series of others, several of which were included in the final bill.

Gregg’s proposal to give the president the ability to send packages of rescissions to Congress for up-or-down votes in both chambers tied the Senate in knots before he agreed to have it considered as an amendment to the minimum wage bill (S 2) that the Senate will begin considering next week.

--MORE--

Thursday, January 18, 2007

Davos 07: the conversation starts here

Now's your chance to post the questions you'd like to ask the world leaders attending Davos next week.

January 18, 2007 12:02 PM

Georgina Henry

Davos, the exclusive Swiss ski resort, is host next week to the annual World Economic Forum - with its stellar cast of world leaders, global businessmen and smattering of politically engaged celebrities. This year's participants include Bill Gates, Tony Blair, King Abdullah of Jordan, Angela Merkel, Joe Biden, Rupert Murdoch, Eric Schmidt, Hua Jianmin, John McCain, Mohammed El Baradei, Sergy Brin, Gordon Brown - and Bono. As Julian Glover blogged, this year's themes are geopolitics post-Iraq, climate change and technology - the shifting power equation, as Davos puts it.

True to that last theme, the WEF is trying to change its closed-door image this year by opening up the discussions to a wider audience online. The Davos Conversation page, which launches next Tuesday (January 22), is a collaboration between them, us at Comment is free, BBC News, the Huffington Post and Jeff Jarvis's Buzzmachine and will integrate blogs, news, video, audio, pictures and reader comments. What we'd like from you from today is questions for participants: every day at least one of the questions posted by text or video will be answered by whoever it's addressed to at the meeting.

If you want to record a video question you need to put it up on YouTube (tagged "davos07" to make sure it's posted on the Davos Conversation page). It's not difficult to do - in fact it's incredibly easy to record and upload a video to YouTube. But now there's an even easier way: go to YouTube's Quick Capture, let it take over your webcam, and you can record and upload a message in one easy step.

Davos say they want an open conversation - so let them have it. Below are some of the 2,000-plus participants to aim questions at - and some of the topics they'll be discussing and which we'll be blogging about. Our main bloggers include Alan Rusbridger, Julian Glover, Larry Elliott and Ben Hammersley, with guest appearances from Ken Livingstone and anyone else we can persuade. On the Davos Conversation page itself, which we'll highlight prominently on Cif from next week, you'll also be able to read all the Davos blogs/news/video/audio from the Huffington Post, Jeff Jarvis and the BBC. We hope that once it's up, you'll also contribute thoughts and comments as the debates unfold.

Heads of state:
Mahmoud Abbas, president of the Palestinian Authority;
King Abdullah II Ibn Hussein of Jordan;
Bertie Ahern, prime minister of Ireland;
Prince Albert II of Monaco;
Ilham Aliyev, president of Azerbaijan;
Gloria Macapagal Arroyo, president of the Philippines;
Shaukat Aziz, prime minister of Pakistan;
Abdullah Ahmad Badawi, prime minister of Malaysia;
Tony Blair, prime minister of the United Kingdom;
Felipe Calderón Hinojosa, president of Mexico;
Jakaya M Kikwete, president of Tanzania;
Luiz Inácio Lula da Silva, president of Brazil;
Thabo Mbeki, president of South Africa;
Angela Merkel, chancellor of Germany;
Ahmed Mahmoud Nazif, prime minister of Egypt;
Nguyen Tan Dung, prime minister of Vietnam;
Fouad Siniora, prime minister of Lebanon;
Viktor Yanukovych, prime minister of Ukraine.

Heads of international organisations:
M El Baradei, director general, International Atomic Energy Agency;
Pascal Lamy, director general, World Trade Organisation (WTO);
Paul D Wolfowitz, president, World Bank;
Koichiro Matsuura, director general, Unesco;

Webcasts include:
The Shifting Power Equation: Lord Browne of Madingley, Michelle Guthrie, E Neville Isdell, Angela Merkel, Sunil Bharti Mittal, James J Schiro, Eric Schmidt, Klaus Schwaz
Connectivity: Sergey Brin, Chris DeWolfe, Chad Hurley
Climate Change: A Call to Action: Margaret Beckett, Lord Browne of Madingley, John McCain
Arab Peace Plan: Amre Moussa
Energy 2007: The New Era of Petropolitics: Ilham Aliyev, Bi Jingquan, Samuel W Bodman, Alexander Medvedev, Jeroen van der Veer, Viktor Yanukovych, Thomas L Friedman
European Identity: David Cameron, Christine Lagarde
China as a Global Player - A Conversation with Hua Jianmin
Who Shapes the Agenda? Gordon Brown, Rupert Murdoch, Eric Schmidt
Is Freedom Over-rated? Shimon Peres
What Is Today's American Dream? John F Kerry, John McCain
A Business Manifesto for Globalisation: Lord Browne of Madingley, Carlos Ghosn, James J Schiro, Joseph E Stiglitz
Delivering on the Promise of Africa: Tony Blair, William H Gates III, Bono
Iraq and The Future of the Middle East: Adil Abd al-Mahdi, John F Kerry, Mohammad Khatami, Javier Solana Madariaga
The Impact of Web 2.0 and Emerging Social Network Models: Chris DeWolfe, Caterina Fake, William H Gates III

Georgina Henry joined the Guardian in 1989 as media correspondent and took over editing the media pages a year later. She was appointed deputy features editor in 1992. She was deputy editor of the Guardian from 1995-2006 and on the board of Guardian Newspapers from 1996-2006. She is now the editor of Comment is free.

Wednesday, January 17, 2007

Cost Of Iraq War: $1.2 Trillion

January 17, 2007
Economix
What $1.2 Trillion Can Buy
By DAVID LEONHARDT

The human mind isn’t very well equipped to make sense of a figure like $1.2 trillion. We don’t deal with a trillion of anything in our daily lives, and so when we come across such a big number, it is hard to distinguish it from any other big number. Millions, billions, a trillion — they all start to sound the same.

The way to come to grips with $1.2 trillion is to forget about the number itself and think instead about what you could buy with the money. When you do that, a trillion stops sounding anything like millions or billions.

For starters, $1.2 trillion would pay for an unprecedented public health campaign — a doubling of cancer research funding, treatment for every American whose diabetes or heart disease is now going unmanaged and a global immunization campaign to save millions of children’s lives.

Combined, the cost of running those programs for a decade wouldn’t use up even half our money pot. So we could then turn to poverty and education, starting with universal preschool for every 3- and 4-year-old child across the country. The city of New Orleans could also receive a huge increase in reconstruction funds.

--MORE--

Friday, December 22, 2006

Democrats and the Deficit: PAUL KRUGMAN

THE COMPLETE ARTICLE
The New York Times

OP-ED COLUMNIST
Democrats and the Deficit
By PAUL KRUGMAN

Published: December 22, 2006

Given a choice between cutting the deficit and spending more on good things like health care reform, Democrats in Congress should choose the spending.


Now that the Democrats have regained some power, they have to decide what to do. One of the biggest questions is whether the party should return to Rubinomics — the doctrine, associated with former Treasury Secretary Robert Rubin, that placed a very high priority on reducing the budget deficit.

The answer, I believe, is no. Mr. Rubin was one of the ablest Treasury secretaries in American history. But it’s now clear that while Rubinomics made sense in terms of pure economics, it failed to take account of the ugly realities of contemporary American politics.

And the lesson of the last six years is that the Democrats shouldn’t spend political capital trying to bring the deficit down. They should refrain from actions that make the deficit worse. But given a choice between cutting the deficit and spending more on good things like health care reform, they should choose the spending.

In a saner political environment, the economic logic behind Rubinomics would have been compelling. Basic fiscal principles tell us that the government should run budget deficits only when it faces unusually high expenses, mainly during wartime. In other periods it should try to run a surplus, paying down its debt.

Since the 1990s were an era of peace, prosperity and favorable demographics (the baby boomers were still in the work force, not collecting Social Security and Medicare), it should have been a good time to put the federal budget in the black. And under Mr. Rubin, the huge deficits of the Reagan-Bush years were transformed into an impressive surplus.

But the realities of American politics ensured that it was all for naught. The second President Bush quickly squandered the surplus on tax cuts that heavily favored the wealthy, then plunged the budget deep into deficit by cutting taxes on dividends and capital gains even as he took the country into a disastrous war. And you can even argue that Mr. Rubin’s surplus was a bad thing, because it greased the rails for Mr. Bush’s irresponsibility.

MORE: http://tinyurl.com/y2wk76

Thursday, December 21, 2006

Special Year-End Issue: Looking to 2007: Global Economics Team, Morgan Stanley

Our baseline forecast points to a sustained global expansion through 2008. After expanding at a 4.8% average pace over the 2003-06 period — the strongest four years of global growth since the early 1970s — we are forecasting a modest downshift to 4.3% in 2007. Such an outcome would be well above the 45-year growth trend of 3.7%, suggestive of a global economy that is coming in for a classic soft landing. Our first cut for 2008 calls for a fractional re-acceleration to 4.5% global growth.

The global downshift in 2007 should be broad-based. The US and Europe are expected to lead the deceleration in the developed world, and a slowing of Asia ex Japan stands out in the developing world. In the US, we expect a housing-related “growth recession” to persist through 1Q07, with important knock-on effects for export-led economies heavily dependent on US demand — especially China, Mexico, Canada, Japan, and other Asian economies tied to China’s supply chain. China’s progress in cooling off an overheated investment sector should provide another impetus to the coming global downshift.

The risks are on the downside of our 2007 global soft-landing scenario. As post-housing-bubble adjustments begin to play out in the US, the risks of spillovers to other sectors — especially personal consumption and business capital spending — are especially worrisome. Lacking in support from private consumption, the rest of an export-dependent world could be surprisingly vulnerable to a US growth shortfall. Pro-labor political shifts in the US, Germany, France, Italy, Spain, Japan, and possibly Australia could shift the pendulum of economic power from capital to labor — raising the risks of trade frictions and earnings pressures that could prove quite problematic for world financial markets.

This is the final issue of the Global Economic Forum for 2006. We will resume regular publication on Tuesday, January 2, 2007. Our very best wishes for the Holiday Season.

Morgan Stanley Global Economics Team

--MORE--

Friday, December 15, 2006

Brimelow, CBS Marketwatch: Gold & Oil to Rule New Year

Peter Brimelow
PETER BRIMELOW
Testing the new year's metal
Commentary: Letter sees growing demand for gold, silver, uranium - and oil


NEW YORK (MarketWatch) -- In the new year, oil and gold will still rule, according a top-performing newsletter.

Justin Litle's Outstanding Investments is the fifth-best performing letter over the past 12 months, according to the Hulbert Financial Digest, up 37.2% vs. the dividend-reinvested Dow Jones Wilshire 5000's 16.54%.

Over five years, Outstanding Investments is up a remarkable 36.88% annualized, vs. 8.86% for the total return DJ Wilshire.

Unquestionably, this is because, for whatever reason, Outstanding Investments has been in synch with a major market move: the rebirth of oil and gold. But you can't argue with Hulbert numbers: It's really worked.

Editor Litle is aware of this, but he's carrying on anyway. As he wrote Wednesday night:
"Every New Year's Eve in recent memory, I've thought to myself: "It can't get any crazier than this. How can the new year possibly top the last?" Yet for five years running at least, the new year HAS topped the last, in all the ways that count.

"2007 is shaping up to be the same, yet even more so. A lot of chickens will be coming home to roost. 2007 could be the year we see oil above $100 ... the year gold breaks its 1980 highs ... the year silver jumps over the moon ... the year developing-world economics and infrastructure woes really hit home ... and that is just a start."

This is true both strategically and tactically. When I last checked in, Outstanding Investments was standing firm with oil and gold. See Oct 16 column

It worked, especially with gold.

Outstanding Investment's latest letter was published some time ago, in early December. The service continues to be intensely focused on what it sees as a looming brute physical shortage of energy, and raw materials generally, in the world.

It wrote: "It's like a broken record, I know: Chinese growth is driving the commodity boom. We hear it all the time. And it's true. The fact of the matter is that China has struck some incredible deals with countries like Canada, Russia and Venezuela, and the list goes on. While we've seen a pullback in many of the commodities in the third quarter, China used that pullback to prepare for the next leg of the rally in commodities. Meanwhile, the U.S. has been asleep at the switch and busy trying to stave off nuclear proliferation in various regions of the world, with about 50/50 success. The U.S. is woefully behind in the race to snatch up valuable resources and lock in key partnerships as we head past the halfway mark of the first decade of the millennium."
One result: Outstanding Investments seconds veteran editor Jim ("The Dines Letter") Dines' fascination with uranium. See Nov. 13 column

For example, Outstanding Investments continues to recommend Cameco Corp. (CCJ
Cameco Corporation...
Sponsored by:
CCJ
)


... despite the recent flooding of the huge Cigar Lake, Saskatchewan, uranium mine, in which Cameco has a half interest. If anything, Outstanding Investments seems to think that this will just exacerbate the supply crunch.

Outstanding Investments does think about other things. For example, its most recent stock of the month was Walter Industries Inc. (WLT
Walter Industries Inc
Sponsored by:
(WLT
)
.

Admittedly, it's partly a high-quality metallurgical coal play. But Walter also owns Mueller Water Products, a leading provider of water infrastructure products. Outstanding Investing thinks U.S. infrastructure is heading for a crisis. And, as it happily quotes someone saying, "Water is the new oil."

Outstanding Investments recommends buying WLT below $48.

Thursday, December 14, 2006

Adens doubt U.S. dollar bullish on bonds

Peter Brimelow
PETER BRIMELOW

Commentary: But chartist sisters still invest 90% in gold, silver, currencies


NEW YORK (MarketWatch) -- More dollar doubts, again from a top-performing letter.
I know, it's my hobby horse recently. See Dec. 7 column
But the fact is that it's simple moves in key markets such as exchange rates that dominate investment performance.

Pamela and Mary Anne Aden have been publishing their Costa Rica-based Aden Forecast since the last gold bull market in the early 1980s. They are chartists, examining market moves in terms of visual patterns. But they also provide intellectually-appealing rationales. See Sept. 5 column

In their just-published December issue, the Aden sisters run a long-term dollar chart and comment: "This shows the dollar going back to 1972 when it first started trading in the free market. As you can see, it's been in a 35-year downtrend since then and it's also been trading in a huge down-trending channel. Within this channel, large drops have taken the dollar from the upper side of the channel to the lower side over the years. Since the current dollar decline started at the upper end of this channel in 2001, it's reasonable to assume that it'll end near the lower end as it has in the past ... If so, that would give the dollar a downside target near .85 against the Swiss franc before this bear market is over. And if that happens, it would mean a 29% drop in the dollar from today's levels."

To put this in perspective: Over the past 12 months, according to the Hulbert Financial Digest, the Aden Forecast has appreciated 15.23%, roughly in line with the dividend-reinvested Dow Jones Wilshire 5000, which is up 16.54%. Over the past five years, however, the Aden Forecast is up an impressive 14.21% annualized vs. 8.86% for the DJ Wilshire 5000.
Other Aden observations in their current letter:
  • Stocks: "The Dow's long-term indicator remains bullish and it has room to rise further ... (But) for now, this chart is telling us that it's not time to be buying common stocks. If the bull market remains intact, we can always get in later, but the way things are unfolding with the dollar, oil and the economy, there's a good chance we won't. The speculation index reinforces this too ... This shows that speculation in the stock market is still at extremely high levels. It's certainly not as high as it was in 2000 when tech stocks were all the rage, but it's high nonetheless ..."
  • Oil: "The oil price ... looks like it has finally bottomed and a renewed rise now appears to be getting underway. That'll be confirmed if oil now stays above $61.75 and then rises above $65."
  • Gold: "If this pattern stays on track, then gold could surpass the $722 level. If it does, gold would be extremely bullish and it could then continue up to its 1980 peak near $850."
  • Bonds (I have to think about this): "The bond market is looking good. Bonds hit a nine-month high this month as long-term yields tumbled to their lowest levels in nearly a year. The bull market in bonds is now picking up steam, but it's still early and prices are poised to rise much further. That being the case, we continue to recommend buying and holding U.S. government long-term bonds."
But, the Adens caution: "Since the U.S. dollar is now showing renewed weakness, we wouldn't keep more than 10% of your total portfolio in bonds at this time. The metals and foreign currencies are stronger than bonds, which is why we advise keeping a larger portion in those sectors, despite the strength in the bond market."

Current Aden asset allocation: 10% U.S. bonds; 30% cash (Euro, British pounds, Australian or New Zealand dollars); 60% gold and silver physical, as well as gold, silver, energy and natural resource shares.

By Peter Brimelow

House prices: Bubble and squeak

Dec 7th 2006
From The Economist print edition

While America's housing market cools, property elsewhere is still hot

IN MANY countries, people are showing little sign of losing their appetite for residential property. Although the pace in several of the raciest markets around the world has eased a bit in the last quarter, prices have risen by more than 10% in the past year in eight of the countries in our table. The Economist has been collating these house-price indicators since 2002, allowing us to track the global residential-property boom (see chart).

However, in America the steam has come out of the housing market. In the year to the third quarter, the index of house prices compiled by the Office of Federal Housing Enterprise Oversight (OFHEO), a regulator, rose by 7.7%, the smallest year-on-year increase for three years. In the quarter itself, prices rose by only 0.9%, the weakest for more than eight years.

The National Association of Realtors reported that the median sale price of existing homes was the same in October as in September, 3.5% less than a year before; according to the Census Bureau, the median price of a new home bounced up in October. But both figures have been affected by a shift in the regional pattern of sales.

Only in the West, where homes tend to be among America's biggest and dearest, did the number of existing or new houses sold increase in the month. In the North-East, sales of new homes dropped by 39%. Across America, existing-home sales were down by 11.5% in the year; those of new properties were down by a quarter.

A huge number of homes is awaiting sale: 7.4 months' supply of both existing and new properties. David Rosenberg, an economist at Merrill Lynch, points out that inventories of new homes are 40% above their historical norm. The number of new properties completed but not yet sold has risen by 50% in the past year, to 166,000. America's builders are cutting back hurriedly. In October alone private residential-construction spending fell by 1.9%; it was 9.4% lower than a year before.

Although America's bubble is deflating, other markets are still looking decidedly frothy. Denmark tops our property-inflation table; elsewhere in Europe, house prices in France, Spain and Ireland are still simmering. In Australia and Britain, where it once seemed that property markets had levelled off, prices have picked up again, rising by 9.5% and 9.6% respectively to November of this year.

In a thoughtful recent study David Miles, of Morgan Stanley, tries to explain the doubling of real British house prices in the past decade. Some of the increase, he says, can be ascribed to rising real incomes; a smaller share can be explained by increases in population; some can be put down to lower real interest rates (including the keener pricing of mortgages by lenders). However, a lot of it is speculative. Between one-third and one-half is due to increased expectations of house-price inflation. These amplify the effects of other factors. Faster increases in prices foster the belief that future increases will also be stronger, so that higher prices fuel demand rather than dampen it.

The need to explain so much of Britain's house-price inflation by a change in expectations, writes Mr Miles, “suggests that the current level of house prices may be rather unstable.” Once those expectations come down, real house prices are likely to fall. The trouble, of course, is predicting when.

Graphic

Wednesday, December 13, 2006

Another Iraq casualty: U.S. auto industry

December 12, 2006
One casualty of the debacle in Iraq seldom gets much press, but the inevitable focus on the mess in Iraq too often overshadows other vital challenges.

The American automobile industry is hemorrhaging. Today, Ford will announce that it will offer buyouts to 85 percent of its salaried work force. Ford is looking to lay off a staggering 52,000 employees by September 2007. Chrysler has already been merged with the German automaker Daimler-Benz. General Motors is gushing red ink.

This industry has been America's industrial stronghold since Henry Ford perfected the assembly line. After World War II, President Eisenhower's defense secretary, Charlie Wilson, wasn't far off when he said, ''What's good for America is good for General Motors and vice versa.'' GM was America's signature company. Its unionized employees won what became the foundation of the American Dream: secure jobs that paid a family wage, with health care, pensions and paid vacations.

Now that social contract is being shredded by the global marketplace. The foolish, ideological commitment to mindless trade policies over the last several decades has devastated Detroit. U.S. automakers must now compete with companies from Europe and Japan that bear no health care costs.

General Motors has about three retirees for every one autoworker; Ford has two for every active employee. Toyota in this country has about 100 retirees in total. The health care and pension costs put U.S. automakers at a staggering cost disadvantage: over $1,200 a car. If they compete on price, they lose money. If they don't compete, they lose market share.

At the same time, we desperately need the industry to move to hybrid and alternative-fuel cars. Detroit is ready to build cars that use alternative fuels made from corn or grasses. But the oil industry that resists putting in the E85 (85 percent ethanol) pumps. These would cut the demand for oil drastically -- and put a crimp in their record profits.

The Ford layoffs alone will hit Michigan, New Jersey, Georgia, Missouri and Ohio big-time, and states like Kentucky will feel the pain. It won't stop with the auto jobs. The auto suppliers, housing markets, hotels, the retail industries that depend on the demand generated by relatively well-paid auto employees will be depressed. We see the pain caused by the steel industry's decline. But the steel industry is a pimple compared with the rash of economic losses that the decline of Detroit will cause.

Obviously, this crisis requires urgent, intense national action. Are we prepared to let the auto industry die? If not, what steps can be taken to relieve the burdens of their health care and pension costs? What should be expected from the automakers in return in terms of investment, jobs guarantees, fuel efficiency and alternative-fuel cars? What penalties or incentives should be provided to the oil industry to force proliferation of alternative-fuel pumps in gas stations? How does all this fit into a concerted drive for energy independence?

Yet when the CEOs of the auto industry sought to meet with George W. Bush before the election, he canceled two meetings with them. When they finally met, an obviously distracted president gave them all of one hour, and nothing was decided.

This is catastrophic. Understandably, the president and his advisers are focused on what may be the worst foreign policy debacle in our history, in Iraq. But the collapse of Detroit may well be the equivalent defeat in our economic history. Surely our auto companies' futures cannot be left to a market in which their competitors enjoy massive state subsidies and mercantile trade policies. We need a considered national policy for our industrial future.

We tend to think of Iraq as a crisis ''over there.'' In fact, it is taking casualties here at home. The cost of the war is evinced not just by the brave men and women who are sacrificing life and limb, not just by the literal trillions of dollars that will be wasted, but by the collapse of America's own economy. It remains neglected as our leaders focus on troubles abroad rather than threats here at home.

The Complete Failure of Supply-Side Economics: Bonddad

Dec 13, 2006

By Bonddad
bonddad@prodigy.net


Starting with Reagan in 1980, the Republican Party embraced and implemented "supply-side" economics. The central theory of supply-side economics was politically an easy sell: if the government cuts tax rates – especially on the wealthy – the wealthy will feel more inclined to earn more money. This will encourage the wealthy to make even more money. This will lead to higher tax revenue, which will more than offset the loss of revenue from the initial tax cuts. The central problem is no matter how you look at the results, they didn’t work as advertised.

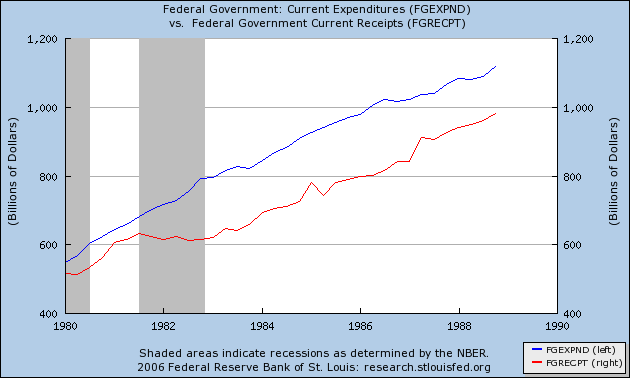
Reagan started the implementation in 1981, cutting upper-income taxes from roughly 70% to 50%. But a funny thing happened. Tax revenues were stagnant for 4 years from 1981 to 1984. For the years 1981-1984, revenues from individual taxpayers were (in billions) $285, $297, $288 and $298, (click on historical budget data) respectively. While the double-dip recession is partially responsible for the first two years, the economy came out of the recession November 1982. Yet for two more years, the rich didn’t feel unencumbered enough to increase their work efforts. At the same time, discretionary spending increased from $307 billion to $379 billion – an increase of 29%. This discrepancy between revenues and receipts then continued for the rest of Reagan’s presidency. Here is a chart from the St. Loius Federal Reserve that shows the discrepancy. Expenditures are blue and receipts are red.

Photobucket - Video and Image Hosting

There are three problems with Reagan’s overall economic policy. The first is the massive amount of debt he incurred for economic growth (which we’ll get too in a minute). The second was Reagan did not implement the other side of conservative fiscal policy – cutting spending. The third problem was the US did not achieve a super-human rate of national product growth. The median quarterly change in GDP during Reagan’s tenure was 3.85%. This is a good rate of growth. But the cost was substantial because to achieve this growth Reagan used debt which the US has not paid off.

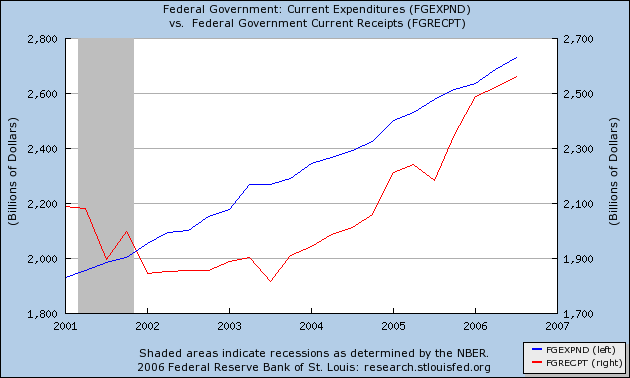
Bush 43 has attempted the same policy with the exact same result. Bush 43 has cut taxes twice. Yet revenue from individual taxpayers has not increased sufficiently to make-up for the loss in revenue. Revenue from individual taxpayers was $994 billion in 2001 and $1.08 trillion in the third quarter of 2006. However, Bush 43 has increased discretionary spending from $649 billion in 2001 to $967 billion in 2005. As a result, the gap between federal revenue and spending is similar to Reagan’s graph.

Photobucket - Video and Image Hosting

On the chart above, notice the scale for revenue on the right is $100 billion less per line than the expenditure line on the left.

As with Reagan, the US has achieved a good rate of economic growth, but hardly super-human in level. In short, as with Reagan’s economic plan, the growth achieved is insufficient to stimulate the economy to high enough levels to make-up for the loss in revenue.

The end result of all of this is simple: Reagan and Bush have mortgage our economic future with debt.

Photobucket - Video and Image Hosting

What makes this system even more sinister from a policy perspective is the issue of "rentiers". This is the fancy, eco-geek way of saying there are people who sit back and make money off of the current system without doing much except lobbying the government to maintain their benefits. In the current system, the US economy needs large pools of capital that will buy government debt to finance the economy. These people don’t really do much except collect principal and interest payments on the national debt. That’s their job and function in the US economy. Ever wonder why the Republicans were so interested in passing a capital gains tax cut? Now you know. The current national economic structure needs people who are willing to buy US debt. Therefore, we need to encourage that behavior with a tax code that benefits people who buy government bonds. The problem is this structure becomes self-defeating. As the government issues more debt, it needs more people to buy bonds. To do that, it continues to cut taxes to make government debt a more attractive investment, which in turn increases the use of debt to finance the US government. And around and around the cycle goes.

This also partially explains why the US can't take a stronger stand against China. China has routinely violated their WTO commitments on a host of fronts. However, the US needs the Chinese to buy US debt to maintain the American way of life. Hence, the US' over-reliance on debt makes it impossible for the US to use the "bully-pulpit" to challenge trade violations.

"So BD – why do you always harp on "supply-side" economics? We know it doesn’t work as advertised. Never has, never will." Here’s why I always harp on it.

The Republicans still believe in it.

They’ll find all sorts of ways to sell it, to make the basic facts fit their premise and to lie about it. No matter how many facts they encounter, they will find a way to make their dream theory come true. Since they list this election, they will return to their political roots, one of which is supply-side economics. And we have to beat them to the punch. We have to tell everybody until the whole country knows it’s a scam.

As the Democrats start to implement policy they will face tough choices regarding taxes, spending and government debt. And there are no easy answers to the questions they will face. The Republicans will jump in with their magic elixir of supply-side economics to make the problem seemly go away.
We have to prevent that from happening.

For more discussion on current economic matters, visit the bonddad blog.

Tuesday, December 12, 2006

The `Skyscraper Curse' Is Worth Watching in 2007

William Pesek

By William Pesek

Dec. 11 (Bloomberg) -- Hundreds of thousands of Taiwanese have been taking to the streets of Taipei in recent months to oust their president, prompting observers to wonder what gives.

Corruption is behind the protests, many will say. Prosecutors have been questioning President Chen Shui-bian over a series of scandals. Others point to his unsteady handling of relations with China, which considers Taiwan a renegade province. I'm wondering if it might make more sense to look at the skyline.

Standing out amidst the tangle of skyscrapers is the 1,671- foot (509 meters) Taipei 101, which is currently the world's tallest building. Its presence, coupled with a worsening political crisis that could trip up the economy, reminds one of the ``Skyscraper Curse.''

A bizarre suggestion, perhaps, and certainly an unscientific one. Yet history shows an uncanny correlation between tallest building projects and financial crises. Be it in Kuala Lumpur in 1997, Chicago in 1974, New York in 1930 or the biblical Tower of Babel long ago, mankind's penchant for architectural overreach is a strangely reliable omen of troubles.

A coincidence? Perhaps, yet economists such as Mark Thornton, senior fellow at the Ludwig von Mises Institute in Auburn, Alabama, argue that skyscrapers can speak volumes about a nation's wealth, technological prowess, ambition and, perhaps most importantly, hubris.

Rome's Last Days

``It's these features that make skyscrapers, especially the construction of the world's tallest building, a salient marker of 20th-century business cycle,'' Thornton argues.

For a time in the early 2000s, analyst Andrew Lawrence, then with Deutsche Bank Securities in Hong Kong, published a periodic ``Skyscraper Index'' for investors. As 2007 approaches, perhaps we need to start producing more building-project barometers.

Take Dubai, which is undergoing one of history's greatest construction booms. After visiting the city recently, economist Claudia Zeisberger of the Asia Pacific Institute of Finance at Insead in Singapore quipped: ``All the building going on made me feel like I was experiencing the last days of ancient Rome.''

Perhaps it is just a coincidence, but Dubai is putting the finishing touches on a 2,300-foot building that will top Taipei 101. In China, the 101-story Shanghai World Financial Center will become the most populous nation's tallest building. And a residential construction project in Chicago will top the Sears Tower, currently North America's tallest skyscraper.

Excess Cash

In India, developers are planning to build a 140-story skyscraper in the city of Gurgaon, near New Delhi. In 2008, South Korea will complete the 1,903-foot International Business Center, which the government hopes will solidify Seoul's place as a global business hub. Massive skyscrapers also are being considered from Australia to Russia to Brazil.

``It all makes sense given current conditions,'' Thornton says.

Even though the Federal Reserve, Bank of Japan and European Central Bank have been raising interest rates, markets are still awash in excess cash. Loose monetary policies have fueled investment frenzies in London, Shanghai, Tokyo and elsewhere. They have increased the amount of leverage in the global financial system, raising the stakes if growth slows markedly in 2007.

Over-investment and financial speculation led to each of the Skyscraper Curse episodes during the 20th century. Coincidence or not, history suggests such projects are often less about technological innovation than economic booms. The desire to have the tallest building correlates suspiciously well with sudden capital inflows that pump up credit creation and confidence.

Presaging Gloom

In 1908, for example, New York's 47-floor Singer Building opened, followed by the 50-story Metropolitan Life Building. Both were planned, financed and raised while the U.S. was in the midst of the Panic of 1907, a credit crunch that necessitated help from financier J.P. Morgan.

In 1929, the opening of 40 Wall Street and the Chrysler Building were harbingers of the worst-ever U.S. meltdown, the Great Depression. A year later, the Empire State Building became the world's tallest building, presaging years of gloom.

The 1970s saw the completion of New York's World Trade Center and Chicago's Sears Tower. They opened amid stagflation in the U.S. economy, a fiscal crisis in New York and the breakdown of the Bretton Woods monetary system.

Tall Task

More recently, Malaysia's 1,483-foot Petronas Towers were being completed during the Asian crisis. And in 2004, Taipei 101 grabbed the tallest-building title. That was the year in which President Chen survived an assassination attempt and tensions with China hit a fever pitch.

I guess we will stay tuned to events in Taiwan. Ditto for the architectural one-upmanship afoot in countries hoping to draw attention to their skylines.

Thickening the plot: the plunge in the U.S. dollar analysts have predicted for years may come in 2007. Other risks include a slowdown in China, higher global interest rates and inflation and geopolitical risks from North Korea, Iran, Iraq and a number of other regions. Oil prices also might climb anew.

Add in the rapid increase in the number of hedge funds and the proliferation of the so-called yen-carry trade. The trade, a favorite among hedge-fund managers, involves borrowing in ultra- low-interest-rate yen and re-investing the funds in riskier, higher-yielding assets elsewhere. It is believed to have greatly increased leverage in markets around the globe.

None of this means a crisis is in the cards -- not the smorgasbord of risks out there, not the construction trends, not the vagaries of boom-and-bust cycles. Yet a smooth year would mean avoiding the Skyscraper Curse. History suggests that's a tall task.

(William Pesek is a Bloomberg News columnist. The opinions expressed are his own.)

To contact the writer of this column: William Pesek in Tokyo at wpesek@bloomberg.net .

Last Updated: December 10, 2006 13:52 EST

Monday, December 11, 2006

Expect 20 hedge funds to collapse each year, warns FSA

The Times December 09, 2006

Patrick Hosking, Banking and Finance Editor

Call for more information on fees
Promise to look at relaxing rules

Day of the locust

More than 20 hedge funds are likely to collapse each year, the chairman of the Financial Services Authority predicted, as he called for more transparency from the industry.

Sir Callum McCarthy said that the failure rate of hedge funds was relatively small at 0.3 per cent, but, with 8,000 funds worldwide, “we might expect slightly over 20 to come to collapse this year”.

The chief City regulator called on the industry to provide more information on fees, redemption penalties and other opaque areas before plans to open it up to small investors.

It was “increasingly anomalous” that UK retail investors were prevented from investing in funds of hedge funds, he said, promising a consultation early in 2007 to relax the rules.

Referring to the implosion of Amaranth Advisors, the American hedge fund that lost its investors about $7 billion (£3.6 billion) in September after being wrongfooted by naturual gas prices, Sir Callum said that investors had been undaunted by its failure. He said that the FSA was relaxed about hedge fund failures as long as there was no danger to the stability of the financial system. Addressing fellow regulators in Germany, Sir Callum tried to diffuse German hostility to hedge funds, arguing that demonising the industry was to miss the point.

Hedge funds were converging with so-called traditional fund managers and many banks, brokers and insurers were already carrying out trades indistinguishable from hedge funds.

In an oblique reference to one senior German politician’s famous attack on hedge funds as “locusts” two years ago, Sir Callum said: “Luckily. . . I am a regulator and not an entomologist.”

Sir Callum called for hedge fund managers to spell out details of their fee structures. Typically they charge 2 per cent of funds under management plus 20 per cent of profits. Yet the true cost to investors is often buried in complex conditions governing hurdle rates of return and allowable expenses.

“Any hedge fund manager, like other asset managers, should disclose these clearly to potential investors,” Sir Callum said.

They should also fully disclose redemption arrangements, including the existence of so-called side letters, documents conferring favourable terms on some investors. There also needed to be more detail on valuation procedures, a controversial area for hedge funds that often own illiquid assets for which there is no market price. Sir Callum said there was “potential for dishonesty” in valuing complex instruments like collateralised debt obligations and catastrophe bonds.

Global Lessons

Global
Global Transitions
December 11, 2006

By Stephen S. Roach | New York

After four years of the strongest growth since the early 1970s, the global economy is entering an important transition. The character of that transition is the subject of endless debate. Financial markets are currently priced for a Goldilocks-like soft landing -- a benign slowdown that tempers inflation and interest rate pressures. The risk, in my view, is that global growth could fall well short of consensus expectations -- with important implications for unsuspecting markets.

I suspect that our current baseline forecast offers only a hint of the coming transition in the global economy. While our projected 4.3% increase in world GDP for 2007 remains well above the 45-year growth trend of 3.7%, it falls significantly short of the 5.0% increase we currently estimate for 2006. The anticipated downshift is broad-based, with the US and Europe leading the way in the developed world and a slowing in Asia ex Japan -- especially China and India -- standing out in the developing world (see accompanying table). Our downwardly-revised US forecast reflects the repercussions of a post-housing-bubble shakeout, whereas the slowdown in Europe is expected to be driven by fiscal consolidation in Germany and Italy, along with the lagged impacts of ECB monetary tightening and a stronger euro. In an increasingly interdependent world, it also makes sense to mark down our growth forecasts in Asia, largely because it will be next to impossible for the region’s export-dependent economies -- especially China -- to avoid the impacts of a slowing of end-market demand in the US and Europe.

Downshifts in the US and China should not be taken lightly. By our reckoning, these two economies have collectively accounted for over 60% of the cumulative growth in world GDP over the past five years -- including direct effects (43%) and the indirect effects traceable to trade linkages (at least another 20%). A key question for the global outlook, in my view, is not whether new sources of global growth have emerged on the scene -- the so-called decoupling thesis -- but whether we have gone far enough in marking down our forecasts for the US and China.

Our US team now concedes that America has lapsed into a temporary “growth recession” -- econo-speak for a growth rate that is sluggish enough to allow the unemployment rate to start rising again (see the 11 December dispatch by Richard Berner and David Greenlaw, “It’s a ‘Growth Recession,’ Not a Lasting Downturn”). They are now looking for three quarters of just 2% annualized growth in real GDP over the 3Q06 to 1Q07 interval -- a downward revision of 0.6 percentage point from their previous forecast. This scenario has soft-landing written all over it -- a surgical strike on the housing market that leaves the rest of the US economy relatively unscathed. The growth recession is expected to be relatively short-lived, giving way to a projected 3.0% annualized rebound in real GDP in the final three quarters of 2007.

In cutting their near-term growth forecast, Dick and Dave concede that the risks remain on the downside. I couldn’t agree more. The difference between us is that I would assign a higher probability to those risks than they do. I fear that the soft-landing crowd has been too quick to pounce on the first signs of softening as confirmation of the endgame to the current downturn. Experience teaches us to be wary of the lags in jumping to premature conclusions about the scope and duration of cyclical adjustments. Take the residential construction sector, for example. Employment in the residential building and specialty trade contractors industries, combined, has now declined by 110,000 from the February 2006 peak -- reversing only 15% of the cumulative run-up that occurred over the preceding five years. With housing starts already down 35% from their peak, it seems perfectly reasonable for employment in this sector to fall a good deal further -- a headcount reduction that would constrain overall labor income generation and put heightened pressure on personal consumption.

It’s not just the nascent recession in homebuilding. Also at risk are the related businesses like furniture, appliances, mortgage finance, and real estate brokers. And, of course, there is the likely unwinding of the consumer wealth effect. Only asset-driven wealth effects can explain how a decade of frothy consumption growth (3.7% in real terms) has exceeded after-tax real income growth (3.2%) by an average of 0.5 percentage point per year. With the last bubble now bursting, I suspect that the wealth effect is about to turn negative for overly-indebted, saving-short US households -- dragging consumption growth below the pace of income generation as rational households abandon asset-based saving strategies and return to more of an income-based approach. As consumption slows, demand-driven capital spending should be quick to follow -- precisely the inference that can be taken from a weak capital goods report in October. The lesson of post-bubble shakeouts is important here: When a booming sector goes bust -- dot-com six years ago, housing today -- there are no built-in firewalls that contain the ripple effects. The US soft-landing scenario does not adequately allow for these risks, in my view.

Moreover, I am highly suspicious of the idea that the rest of the world is likely to be insulated from a US growth shortfall. China, the fourth-largest economy in the world, devotes an outsize 35% of its GDP to exports -- and the US is its biggest external market. In Japan, the second-largest economy, exports are 17% of GDP, and the US and China are its two largest customers. For Canada, the 8th-largest economy in the world, exports to the US account for fully 27% of its GDP. In Mexico, the world’s 13th-largest economy, US exports make up 24% of its GDP. And these are just the direct effects. Supply-chain linkages throughout the world -- especially to Asian suppliers of the Chinese assembly line such as Korea, Taiwan, and Japan -- will compound the impacts of a demand shortfall in China’s largest export market, the US. It would be one thing if the non-US world could draw incremental support from improving internal demand -- especially private consumption. But consumption shares are still falling in China, and a recent downward revision underscored a similar and very disappointing development in Japan. Moreover, European consumption is currently adding no more than one percentage point to pan-regional growth. With Asia and Europe lacking any vigor in their autonomous consumption dynamic, global decoupling seems all the more a stretch. That raises yet another important question mark for the global soft-landing scenario.

The China factor bears special mention -- not just because of the export linkages noted above but also because of some important developments on the internal demand front. The Chinese seem increasingly determined to cool off an overheated investment sector -- hardly surprising with fixed investment now nearing an unheard of 50% of GDP. A failure to bring an increasingly irrational capital allocation process under tighter control is a recipe for capacity overhangs and deflation. The Chinese are mindful of these very risks and are hard at work in shifting their growth focus. Reflecting the combined impacts of administrative controls and monetary tightening, there has been a discernible slowing in the growth of both industrial output and investment in the final months of 2006. I expect more of that to come in early 2007 -- sufficient to take Chinese real GDP growth down from the blistering 11.3% comparison of mid-2006 into the more sustainable 8-9% range by year-end 2007. Meanwhile, the Chinese are hard at work in laying the groundwork for a pro-consumption tilt to the growth dynamic -- consistent with the better balance that a higher-quality growth experience ultimately requires. For China, this could well mark a critical transition in its remarkable economic development -- with important implications for Asia, the broader global economy, and for what has been an increasingly China-centric dynamic at work on the demand side of major commodity markets.

The year ahead is not just about a looming transition in the global business cycle. It could also mark an important transition in the globalization debate. I suspect that the focus is likely to shift away from the brilliant successes of China and India toward an increasingly politicized pro-labor pushback from the rich countries of the developed world. The income shares of the major industrial economies are all at extremes -- record high returns to capital and record lows for labor shares. Courtesy of an increasingly powerful IT-enabled globalization that is now affecting both tradable manufacturing and once non-tradable services, job growth and real wages in the high-cost developed world remain under unusual pressure. That’s great for corporate profits but very tough for real wages. A pro-labor shift in the political power base of the industrial economies -- already evident in the US, Germany, France, Italy, Spain, Japan, and possibly Australia -- could lead to a reversal of these trends. It opens up the possibility that the pendulum of economic power might well begin to swing from capital back to labor. Such a development, in conjunction with our forecast of a significant slowing in global GDP growth, implies a weaker-than-expected top line for global businesses. That could have profound consequences for the earnings cycle that continues to underpin ever-frothy world financial markets. Moreover, to the extent any pro-labor shift has protectionist overtones, it could also prove to be a stern test for globalization, itself.

In looking to 2007, my main message is to be wary of extrapolation. After a powerful four-year boom, an important transition lies ahead for the world -- both on economic as well as on political terms. The consensus appears to be unprepared for the full extent of the transition that could well occur -- banking on the benign outcome of a soft landing in the US to be offset by accelerating growth elsewhere in a decoupled world. The official baseline forecast of the IMF is quite consistent with such a sanguine prognosis. It calls for a 4.9% increase in world GDP next year -- virtually identical to the 4.8% average gains over the 2003-06 period. The Morgan Stanley forecast of 4.3% global growth is already well below that consensus. As post-housing bubble adjustments begin to play out in the US, the lags of an interdependent and still unbalanced global economy are only just beginning to kick in. And a new group of politicians is only just beginning to take the reins of power. All this underscores the possibility that we may not have gone far enough in factoring in the downside risks to global growth in 2007. Transitions are never easy -- especially when juxtaposed against the complacency spawned by four fat years.


United States
It’s a “Growth Recession,” Not a Lasting Downturn
December 11, 2006

By Richard Berner | New York

Forecast at a Glance

2006E

2007E

2008E

Real GDP

3.3%

2.4%

3.0%

Inflation (CPI)

3.3

1.6

1.9

Unit Labor Costs

3.3

3.2

2.7

After-Tax “Economic” Profits

22.2

3.8

4.7

After-Tax “Book” Profits

19.3

2.1

2.4

Source: Morgan Stanley Research E = Morgan Stanley Research Estimates

We’ve sharply cut our near-term expectations for US growth, with the advance in GDP averaging 2% annualized for the three quarters ending in the first quarter of 2007, or about 0.6 percentage point below our estimate of just a month ago. More important, while our estimate of roughly 1½% for the fourth quarter of 2006 is the low-water mark for growth in our baseline outlook, the pickup we now envision likely will be slow, and a return to the trend of 3% probably awaits the summer of 2007.

This “growth recession” — a period of growth appreciably below potential — likely will last long enough to reduce somewhat the lingering upside risks to inflation. As we previewed last week, the combination of slower growth and reduced inflation risks, if it occurs, will thus allow the Fed to stay on hold for much of 2007, and to ease gradually as inflation moves lower late next year and into 2008 (see “Changing the Fed Call,” Global Economic Forum, December 4, 2006).

Now that our calls are close to consensus, what are the risks for the economy and for financial markets? Most important, we do not see this period of sluggish growth as the prelude to a more lasting downturn in economic activity. And thematically, like the consensus, we envision rising personal saving, peaking inflation, and a steeper yield curve in the year ahead. But in our view these themes may play out in ways the consensus doesn’t envision, and that may make all the difference for the outlook. Here’s why.

For the economy, we see risks evenly balanced around our new, more subdued baseline. We continue to envision a ‘two-tier’ economy, with housing and Detroit now in recession, and the forces sustaining growth in the rest of the economy skirting the fallout from those industry downturns (see “The Two-Tier Economy,” Global Economic Forum, November 6, 2006). As those twin recessions fade, in fact, we expect that the pace of overall economic growth will quicken.

Importantly, however, we’re not “compartmentalists.” Instead, our two-tier call rests on four key premises. First, while we believe that the housing recession is far from over, we think that the intensity of the downturn will peak by spring 2007. Our new baseline does envision a more intense housing recession in the near term than we thought a month ago. We estimate that the decline in housing activity will cut a full percentage point from GDP both in the current quarter and in the first quarter of next year as builders are moving even more aggressively to cut supply.

But the pace of declining housing demand seems to be slowing, and that combination seems likely to reduce the odds of declines in home prices appropriately measured on a nationwide basis (see “False Dawn for Housing? Global Economic Forum, December 8, 2006). And we continue to think that the housing wealth-consumer spending link is weaker than many believe. As a result, the spillover from housing wealth to consumer spending seems unlikely to derail the consumer.

A second key premise is that the economy’s income-generating capacity has improved sustainably, and by enough to allow consumers to rebuild personal saving in the face of decelerating housing wealth while maintaining moderate gains in spending. Solid job gains, firmer labor markets and thus wage gains, and a decline to 2% headline inflation have lifted real wage income growth to a solid 4½% annual rate over the year ended in October.

November’s employment canvass implies more of the same: Nonfarm payrolls rose by 132,000, not far from the 150,000 (1.3% annualized) average in the first ten months of 2006, especially considering the strong, upward pattern of revisions seen since the summer. Demand for labor inputs is stronger still, running at a 2% rate, as the workweek has risen throughout the year after adjustment for changes in the industry composition of employment. And while sharp downward revisions to GDP-based compensation per hour data call into question the pattern of wage growth, we believe that the acceleration in private hourly earnings to 4.1% in the year ended in November reasonably represents the current pace. While personal saving hasn’t yet turned back into positive territory, the fourth-quarter combination of 6.2% annualized growth in real disposable income and 2.9% in spending suggests that it will do so soon.

The third key notion is that while global growth may be slowing, growth in domestic demand abroad is still stronger than in the United States, and thus net exports seem likely to contribute to US growth (for the global outlook, see Steve Roach’s accompanying dispatch, “Global Transitions”). We don’t buy into the decoupling story — that overseas growth is immune to US weakness. But growth in domestic demand in our two major trading partners, Canada and Mexico, remained at 4.1% and 5%-plus through the third quarter, and in the Eurozone, it eclipsed the 2½% US pace for the first time since the 2001 recession. And of course, in much of Asia and Latin America, such demand has long outpaced that in the US. US exports must grow twice as fast as imports to narrow the gap in real net exports, and we’re betting that the growing gap between US growth and that abroad, combined with the incipient decline in the dollar, will bring that about.

Finally, we think that notwithstanding a monetary policy that has become mildly restrictive, US financial conditions are still supportive of growth. If anything, the rise in stock prices, the decline in interest rates, the tightening of credit spreads, and the decline in the dollar have recently made financial conditions still easier. Credit-sensitive demand should benefit: With pent-up demand for capital spending still positive, we expect that the deceleration in equipment and software outlays to a 3.5% annualized pace in the last three quarters of 2006 will give way to a faster pace in 2007.

Against that backdrop, we see slightly less inflation risk than a month ago, because four quarters of growth averaging 2.2% will begin to reverse the narrowing of economic slack that characterized the first four years of the expansion. The gap between actual and potential growth will widen somewhat, the unemployment rate will rise towards 5% (in part as labor force growth outpaces employment), and future operating rates in industry will rise only slowly.

Nonetheless, in our view, inflation has yet to peak and likely will turn down gradually. That’s because inflation expectations remain slightly elevated, the relationship between economic slack and inflation is not a strong one, and the dollar is now declining. Measured by the core personal consumption price index (PCEPI), inflation has leveled off at 2.4%, but in the past three months has moved higher. Measured by the University of Michigan’s 5-10 year median, longer-term inflation expectations edged above 3% in December. The so-called Phillips curve may well be flatter than in the past, meaning that just as a substantial reduction in slack only pushed inflation up moderately in this expansion, a little increase in slack won’t go very far to reduce it. And while the dollar has only declined by about 2% on a broad, trade-weighted basis in the past eight weeks, the direction could offset disinflationary forces, especially with import prices of consumer goods excluding automotive products up 1% in the year ended in October.

Like the consensus, we believe that the yield curve will disinvert or resteepen from current levels, but how that happens is critical. Many think that a turn toward ease will be the dominant factor, so that short-term rates decline by more than long-term rates, in classic cyclical fashion. In contrast, we think cyclical comparisons probably won’t help analyze the current yield curve setting. We think that the Fed will anchor short-term rates, and long-term rates may rise somewhat from current levels.

Following November’s employment report, market participants dramatically scaled back the chance of Fed ease by the March FOMC meeting to 30% from 70% just a week ago. Those odds will probably shrink further in coming months. To be sure, Fed officials following this week’s FOMC meeting will surely acknowledge the recent stretch of sub-par growth and its potential disinflationary benefits. But subpar growth has yet to reverse the decline in the unemployment rate, and core inflation, especially measured by the PCE price index, hasn’t come down significantly. Thus, policymakers’ belief that inflation is still too high likely will persuade them to retain their tightening bias. Longer-term yields may rise gradually beyond 4¾% as the odds of a downturn and Fed ease fade, as rising term premiums elevate the level of real long-term yields, and as a weaker dollar may erode the appeal of carry trades.

There are several downside economic risks: The housing recession could deepen, capex is a question mark, and credit quality may begin to erode, triggering tighter lending standards. And weaker growth means more downside risks to corporate earnings. But upside economic risks and their consequences for markets should not be ignored: The housing downturn could end more quickly, the capital-spending pause may have been a false alarm, and although global growth may be slowing, US firms may be getting a bigger market share. For markets that have thrived on low volatility, these crosscurrents may begin to reverse that trend.