By Bonddad
bonddad@prodigy.net
Last week the government released two inflation reports: the Producer Price Index and the Consumer Price Index. The PPI was released first. For the last three months, food prices at the producer level have increased 1.5%, 1.1% and 1.3% respectively. In the CPI report we learn that for the last three months food prices have increased .0%, .7% and .8%. These numbers are way above the trend so I looked at the CRB Agricultural Prices Chart. Here it is:
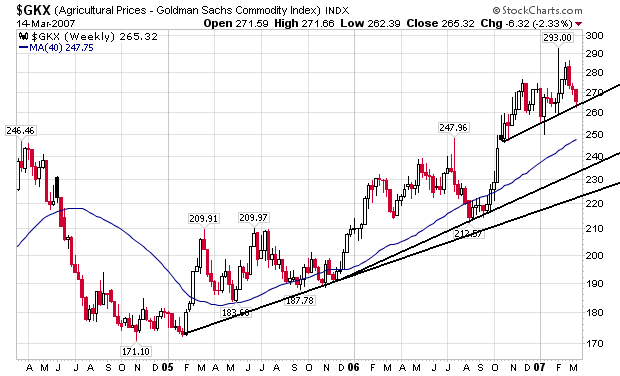
Here are the individual price charts for various grain commodities:
Wheat:
Feed Wheat:
Corn:
Barley:
All of these charts are at least 1 year in duration or longer. This indicates we aren't seeing seasonal fluctuations (which futures are suppose to prevent in the first place). So, what's happening with these prices?
The information below is from the the Department of Agriculture's World Agricultural Production Report
Total US wheat production has dropped from 58.74 million metric tons in 2004 to a projected 49.32 in March of 2007. That's a drop of 16%. Over the same period (2004 to Match 2007's yearly projection) all European countries have decreased wheat production as well. Australia -- which has been hit by a drought -- has seen production drop from 22.60 to 10.5 million metric tons. Overall world production has dropped from 628.59 million metric tons in 2004 to 593.11 million metric tons -- a decrease of 5.62%.
US and world production of course grains is also down. US production has dropped from 319 million metric tons in 2004 to a projected 280 million metric tons in 2007. That's a decrease of 12.2%. Overall world production has dropped from 1,014 million metric tons in 2004 to a projected 966 million metric tons in March 2007. That's a decrease of 4.73%.
And corn production is also down in the US and the world. Over the 2004 to the projection 2007 yield, US production has dropped from 300 million metric tons to a projected 2007 yield of 267 million metric tons (or 11%) while world production has dropped from 712 million metric tons in 2004 to a 2007 projected yield of 693 million metric tons (or 2.66%).
Simple economics states that declining supply = increasing price.
In addition, we have demand increasing from two areas. The first is simple population growth. As more people are born they will naturally want to eat. This obviously increases demand. In addition, there is a new element to demand: synthetic fuels. As the US adopts policies that promote ethanol and other food based fuels, demand increases which pulls prices higher.
Simple economics states that increasing demand = increasing prices.
In other words, we have two basic economic events (decreasing supply and increasing demand) pulling prices higher.
So what does all of this mean? Economically we have several issues:
1.) Inflationary pressures. Last year oil was the big inflation boogie-man. Now food prices may take their place. The charts above show the food prices are spiking. With overall production down over the last three years and a projected lower production level this year supply won't pick-up until next year. That means food based inflationary pressures may be with us for at least another year.
2.) Higher inflationary pressures means the Fed will be less inclined to lower interest rates. If the economy continues to slow, the Fed won't be able to provide monetary stimulus. That could exacerbate an economic slowdown.
3.) The economy has been growing for the 2004-2007 time period, yet food production is down. There may be a bigger problem lurking here.
Anyone who has any insight, please provide it.
No comments:
Post a Comment