By Bonddad
bonddad@prodigy.net
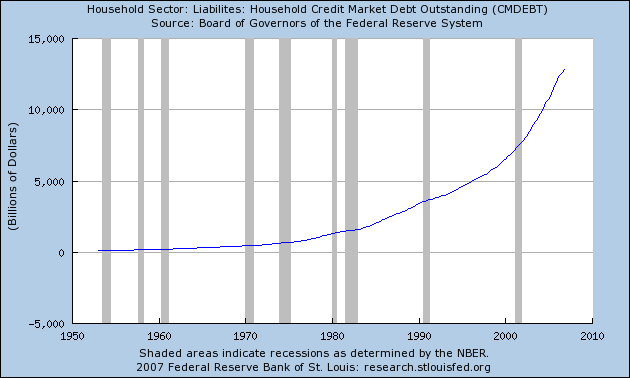
By now I think everyone who reads anything I have written over the last few years is familiar with this graph which shows the rise of household debt over the last 40+ years:
Let's look at how this is playing out.
"Having a credit card is kind of like being a millionaire," says Scott Davis, a 37-year-old facility maintenance worker who lives in Arlington, Texas. He says he and his wife, whose household income is $38,000 a year, had "seven or eight" credit cards they used to buy sporting goods, go on vacations and remodel their home.
Mr. Davis isn't unusual. According to Fed data, outstanding debt, including mortgages, for families in the bottom 50% of earners -- those with household income below $43,000 -- almost doubled to an average $40,676 in 2004 from an inflation-adjusted $20,733 in 1992. Debt outstanding in the top 50% of households rose 83.5% to $150,821 in 2004 from $82,214 in 1992.
Ray Hooper, education and housing director at Consumer Credit Counseling Service in Dallas, says with credit conditions so easy, lower-income consumers have been able to "get what they want, even though they can't afford it." And the easy credit isn't just related to subprime lending. "It's not just the house," adds Mr. Hooper. "It's the furniture, the appliances, the lawn mower."
Let's go back through this paragraph to see what's going on.
1.) The couple had an annual income of $38,000.
2.) They had "7 or 8 credit cards."
Let's go through it one more time ....
$38,000 in income and 7 or 8 credit cards.
That is insane. There is no other way to describe it.
At this point we get into a discussion about the lines between corporate responsibility and personal responsibility. Or better yet, this is really a discussion about the difference between corporate and personal irresponsibility.
Yes I know this couple probably received about 10 mail offers/week for a credit card. And in doing so soliciting companies were pretty irresponsible.
At the same time, when 1 credit card is maxed out it's a really stupid idea to get another card instead of paying the old one off.
But I digress from the point I want to make.
Are we really a rich country, or are we a country living on borrowed growth -- debt-financed growth we haven't paid for yet? The answer is the latter - we're living off growth we haven't paid for yet. Think about the following statement from Barron's (subscription required):
So far this decade, nominal gross domestic product has risen at a 5.1% pace, while outstanding credit-market debt is increasing at 8.4%, notes Punk Ziegel analyst Richard Bove. "If the long-term rates were to rise further or incomes grow at slower rates, then it seems highly likely that there would be a rash of defaults throughout the economy," he says.
Debt is growing faster than GDP. That means -- as the above analyst points out -- if the economy slows we may have a bigger problem as debt defaults move through the system.
This is where another really important issue comes into play -- income inequality which grew in 2005.
Income inequality grew significantly in 2005, with the top 1 percent of Americans — those with incomes that year of more than $348,000 — receiving their largest share of national income since 1928, analysis of newly released tax data shows.
The top 10 percent, roughly those earning more than $100,000, also reached a level of income share not seen since before the Depression.
While total reported income in the United States increased almost 9 percent in 2005, the most recent year for which such data is available, average incomes for those in the bottom 90 percent dipped slightly compared with the year before, dropping $172, or 0.6 percent.
The gains went largely to the top 1 percent, whose incomes rose to an average of more than $1.1 million each, an increase of more than $139,000, or about 14 percent.
The new data also shows that the top 300,000 Americans collectively enjoyed almost as much income as the bottom 150 million Americans. Per person, the top group received 440 times as much as the average person in the bottom half earned, nearly doubling the gap from 1980.
People who aren't benefiting from economic growth -- and there are a ton of those people in the current environment -- want a piece of the pie. That's a natural human emotion. But the problem is to benefit, most people have to go into debt which only increases their inability to move up the socio-economic ladder.
Let me be clear: I'm a capitalist. I like money. I'm not run by this desire, but I certainly wouldn't turn down a million dollars in the name of political thought purity.
At the same time, we have to think about how the benefits of the largest and most productive economy in the world are distributed to everybody -- not just those who can afford to buy the latest political party du jour.
Update [2007-4-2 9:31:11 by bonddad]:: Since 1975, total household debt outstanding has increased as a percentage of GDP.
The Fed's Flow of Funds statement goes back to 1975.
GDP is from the Bureau of Economic Analysis (see link on my blogroll).
Total Household debt outstanding/GDP = total household debt outstanding as a percentage of GDP
75. 734/1638 = 44%
80. 1396/2789 = 50%
85. 2270/4220 = 51%
90. 3589/5803 = 61%
95. 4855/7397 = 65%
00. 6999/9817 = 71%
05. 11803/12455= 94%
06. 12815/13246 = 96%
For economic commentary and analysis, go to the Bonddad Blog
No comments:
Post a Comment