Showing posts with label Bonds. Show all posts

Monday, January 15, 2007

Euro displaces dollar in bond markets

By David Oakley and Gillian Tett in London

Published: January 14 2007 22:08 | Last updated: January 14 2007 22:08

The euro has displaced the US dollar as the world’s pre-eminent currency in international bond markets, having outstripped the dollar-denominated market for the second year in a row.

The data consolidate news last month that the value of euro notes in circulation had overtaken the dollar for the first time. Outstanding debt issued in the euro was worth the equivalent of $4,836bn at the end of 2006 compared with $3,892bn for the dollar, according to International Capital Market Association data.

Outstanding euro-denominated debt accounts for 45 per cent of the global market, compared with 37 per cent for the dollar. New issuance last year accounted for 49 per cent of the global total.

That represents a startling turnabout from the pattern seen in recent decades, when the US bond market dwarfed its European rival: as recently as 2002, outstanding euro-denominated issuance represented just 27 per cent of the global pie, compared with 51 per cent for the dollar.

The rising role of the euro comes amid growing issuance by debt-laden European governments. However, the main factor is a rise in euro-denominated issuance by companies and financial institutions.

One factor driving this is that European companies are moving away from their traditional reliance on bank loans – and embracing the capital markets to a greater degree.

Another is that the creation of the single currency in 1999 has permitted development of a deeper and more liquid market, consolidated by a growing eurozone.

This has made it more attractive for issuers around the world to raise funds in the euro market. And, more recently, the trend among some Asian and Middle Eastern countries to diversify their assets away from the dollar has further boosted this trend.

RenĂ© Karsenti, executive president of ICMA, said: “It is the stable interest rates in Europe that have helped and the fact that [the euro] has strengthened and shown resilience.”

Since the start of 2003, the European Central Bank’s main interest rate has fluctuated only 1.5 percentage points, ranging from a low of 2 per cent in the middle of that year to 3.5 per cent, its rate today.

In comparison, the Fed funds rate, the main US interest rate, has fluctuated 4.25 percentage points, ranging from 1 per cent in the middle of 2003 to 5.25 per cent, its level today. The euro has also risen to trade around $1.30 against the dollar, from around parity three years ago. Sterling issuance has grown in the past three years, reinforcing its attraction as a niche currency among some investors. The yen, in comparison, has fallen out of favour.

Overall, international capital markets have doubled in size in terms of bond issuance during the past six years.

Thursday, December 14, 2006

Adens doubt U.S. dollar bullish on bonds

Peter Brimelow
PETER BRIMELOW

Commentary: But chartist sisters still invest 90% in gold, silver, currencies


NEW YORK (MarketWatch) -- More dollar doubts, again from a top-performing letter.
I know, it's my hobby horse recently. See Dec. 7 column
But the fact is that it's simple moves in key markets such as exchange rates that dominate investment performance.

Pamela and Mary Anne Aden have been publishing their Costa Rica-based Aden Forecast since the last gold bull market in the early 1980s. They are chartists, examining market moves in terms of visual patterns. But they also provide intellectually-appealing rationales. See Sept. 5 column

In their just-published December issue, the Aden sisters run a long-term dollar chart and comment: "This shows the dollar going back to 1972 when it first started trading in the free market. As you can see, it's been in a 35-year downtrend since then and it's also been trading in a huge down-trending channel. Within this channel, large drops have taken the dollar from the upper side of the channel to the lower side over the years. Since the current dollar decline started at the upper end of this channel in 2001, it's reasonable to assume that it'll end near the lower end as it has in the past ... If so, that would give the dollar a downside target near .85 against the Swiss franc before this bear market is over. And if that happens, it would mean a 29% drop in the dollar from today's levels."

To put this in perspective: Over the past 12 months, according to the Hulbert Financial Digest, the Aden Forecast has appreciated 15.23%, roughly in line with the dividend-reinvested Dow Jones Wilshire 5000, which is up 16.54%. Over the past five years, however, the Aden Forecast is up an impressive 14.21% annualized vs. 8.86% for the DJ Wilshire 5000.
Other Aden observations in their current letter:
  • Stocks: "The Dow's long-term indicator remains bullish and it has room to rise further ... (But) for now, this chart is telling us that it's not time to be buying common stocks. If the bull market remains intact, we can always get in later, but the way things are unfolding with the dollar, oil and the economy, there's a good chance we won't. The speculation index reinforces this too ... This shows that speculation in the stock market is still at extremely high levels. It's certainly not as high as it was in 2000 when tech stocks were all the rage, but it's high nonetheless ..."
  • Oil: "The oil price ... looks like it has finally bottomed and a renewed rise now appears to be getting underway. That'll be confirmed if oil now stays above $61.75 and then rises above $65."
  • Gold: "If this pattern stays on track, then gold could surpass the $722 level. If it does, gold would be extremely bullish and it could then continue up to its 1980 peak near $850."
  • Bonds (I have to think about this): "The bond market is looking good. Bonds hit a nine-month high this month as long-term yields tumbled to their lowest levels in nearly a year. The bull market in bonds is now picking up steam, but it's still early and prices are poised to rise much further. That being the case, we continue to recommend buying and holding U.S. government long-term bonds."
But, the Adens caution: "Since the U.S. dollar is now showing renewed weakness, we wouldn't keep more than 10% of your total portfolio in bonds at this time. The metals and foreign currencies are stronger than bonds, which is why we advise keeping a larger portion in those sectors, despite the strength in the bond market."

Current Aden asset allocation: 10% U.S. bonds; 30% cash (Euro, British pounds, Australian or New Zealand dollars); 60% gold and silver physical, as well as gold, silver, energy and natural resource shares.

By Peter Brimelow

Thursday, November 30, 2006

Bonds Say Recession; Stocks Say Soft-Landing. Who's Right? : Bonddad

Schiff: Worse Than Holding Dollars Is Holding Bonds
http://www.safehaven.com/article-6367.htm
---
Nov 30, 2006

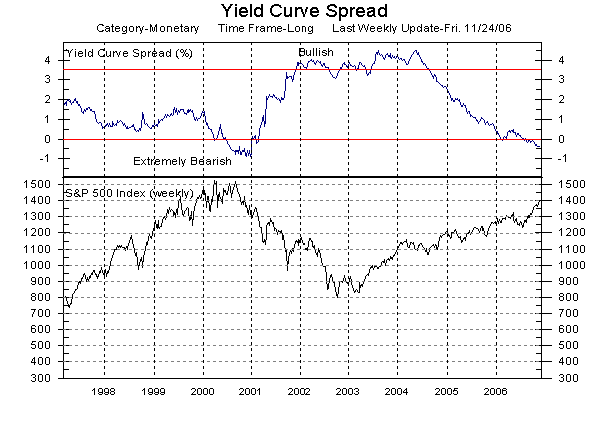
The bond market and the stock market are sending contradictory signals about the next 12 months. The stock market is essentially buying into the Goldilocks scenario – that the economy will slow gradually but will not fall into a recession. The bond market is saying a recession has a higher probability of occurring. There is enough information for both markets to maintain their respective viewpoints for now. Only time will tell which outlook is fundamentally correct.

First, here is a chart from the MarketGuage website – which is a great site for basic market information.

Photobucket - Video and Image Hosting

The top line outlines the difference between the ten-year Treasury bond and the 3-month treasury bone. This is called the "spread". Before we get into what this spread says, let’s go over some yield curve basics.

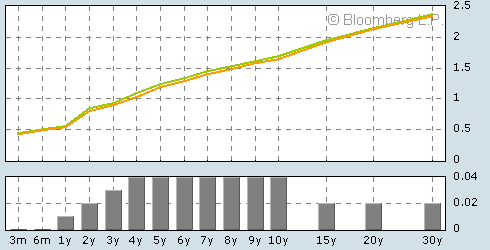
A "normal" yield curve (if there really is such a thing) slops from the lower left to the upper right of a bond yield chart. Here is an example from yesterday’s chart of the Japanese bond market from Bloomberg.

Photobucket - Video and Image Hosting

This graph says a couple of things to an economist. First, the risk associated with longer-term investments is greater than shorter-term investments. This is the natural state of yield curves because there are more things that could go wrong in the long-term in the short-term. Suppose you lent someone money for 6-months and assume they are a good credit risk. There are fewer bad things that can happen to that person to prevent them from paying you back your money. However, if you lent them money for 30-years, there is higher chance that something will happen to prevent them from paying you back. The time horizon is simply too long to calculate all of the negative possibilities. Therefore, you charge a higher interest rate to compensate for the increased risk.

Secondly, this graph says that inflation expectations are higher. It’s important to remember the real rate of return on a bond is the bond’s interest rate minus the prevailing rate of inflation. If traders think inflation is headed higher, they will demand a higher interest rate so they can make more money. Here it’s important to remember that a bond’s price and yield are inversely related: as prices decrease, the interest rate increases and visa verse. So, on the Japanese chart investors are selling the long bond (or at least not buying it), driving longer-term interest rates higher.

Finally, this graph says bond market traders are expecting an increase in interest rates – or, more generally, that the probability of interest rate increases is higher than interest rate decreases. Here’s the reason. If interest rates increase in this environment, people who hold longer-debt will lose money because interest rates across the board will probably increase in one degree or another.

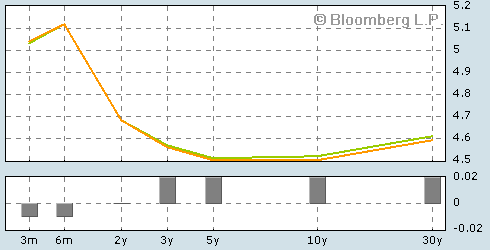
Now, let’s literally reverse everything that’s been said above, with a few changes. First, let’s make the possibility of a rate decrease the most important factor when buying a bond, followed closely by decreased inflation expectations (or reverse them). That would describe the current US yield chart which looked like this at about 3PM EST.

Photobucket - Video and Image Hosting

The above mentioned factors – a decrease in inflation and a decrease in interest rates – are two important factors that happen in an economic slowdown. The central bank lowers interest rates to stimulate borrowing and thereby increase economic activity. Inflation decreases (usually) because there is less demand for products, which lowers the possibility of demand-pull inflation. The general decrease in economic activity lowers the amount of goods business produces, which lowers the purchase of raw materials, which lowers cost-push inflation pressures. Anyway, that is the basic line of thinking involved with the current US yield chart.

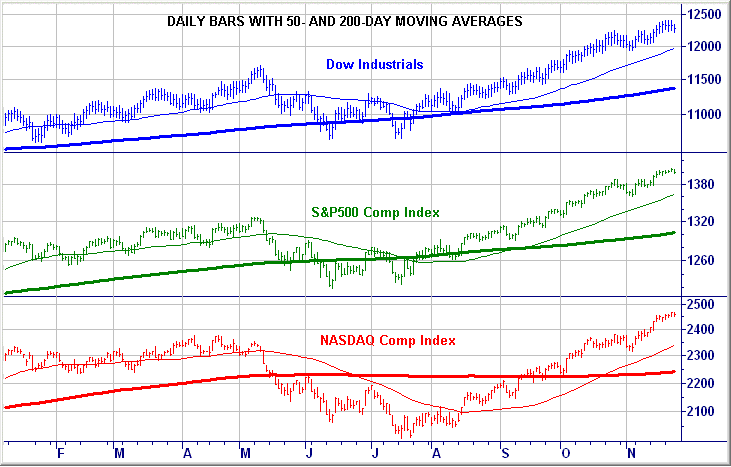
Now, let’s turn to the stock markets, which have all enjoyed a rally starting in July of this year (this chart is from the Martindale Capital Website which has some great charts.)

Photobucket - Video and Image Hosting

All three averages have increased since July. Stocks increase when business conditions are good and stocks decrease when business conditions are bad. The latest earnings season was good for stocks. While GDP has slowed it has not gone negative. The latest inflation gauges have shown a decrease in inflation, meaning the Fed doesn’t have to increase interest rates (at least right now). Basically, traders think the economy will have a soft-landing. This means that growth will slow, inflation will slow, but the economy will not contract. In the words of most Federal Reserve bankers, the US economy will not operate at full capacity, but operate below full capacity.

So – who is right? We won’t know until the economy gives a firm set of signals in either direction. However, it’s important to note there is enough evidence for both markets to take their respective positions.